-1.png)

Managing cloud environments across multiple accounts and regions is a challenging endeavor. Without a unified tool like Uptycs, it's akin to navigating a dense forest without a map. Security teams often grapple with massive amounts of data, trying to synthesize fragmented information from diverse tools and systems. This approach is not only time-consuming but also increases the risk of missing critical vulnerabilities.
Enter the Uptycs' Security Graph feature to address this challenge head-on. It consolidates and visualizes complex cloud security data, providing a comprehensive view of potential security risks. The Security Graph facilitates rapid identification and resolution of security weaknesses, enabling informed decision-making and enhancing an organization's ability to proactively manage cloud security threats.
Additionally, the integration of Security Graph with other features of Uptycs, such as cloud discovery, attack path analysis, and Ask Uptycs, transforms the way security teams engage with their cloud environment. This synergy makes visible the often unseen connections within the cloud, offering strategic insights into potential breach pathways, and provides an intuitive interface for deep dives into security data.
Cloud Discovery illuminates the often invisible connections within your cloud environment, Attack Path provides a strategic understanding of potential security breach routes, and Ask Uptycs offers an intuitive way to interrogate and understand the vast array of security data. These elements, in synergy with the Security Graph, provide a multi-dimensional approach to navigating and mastering the complexities of cloud security.
.png?width=2858&height=1599&name=1%20(1).png) Figure 1 - Uptycs Security Graph
Figure 1 - Uptycs Security Graph
By weaving together endpoint and cloud workload data, Security Graph provides a clear, actionable picture of the cloud security landscape. This not only streamlines the process of identifying and addressing vulnerabilities but also empowers organizations to proactively manage their cloud security posture, turning the daunting task of cloud security into a navigable and manageable journey.
Empowering security teams through practical use-cases
Uptycs Security Graph isn't just a theoretical tool; it has practical applications that significantly benefit security teams.
To better appreciate the power of visualizing complex cloud security data with Uptycs Security Graph, continue reading for practical, real-world examples. These examples highlight how the tool's capabilities translate into tangible benefits in diverse scenarios. Here are a few of the many use cases it solves for:
Use-case 1: Blast radius analysis
Use-case 2: Pinpointing misconfigurations with zero trust score integration
Use-case 3: Enhanced container security and vulnerability management
Use-case 4: IAM visibility
Use case 1: Blast radius analysis
The Uptycs Security Graph offers a critical capability in understanding and mitigating risks associated with API and SSH access within cloud environments. Its ability to swiftly identify which assets, like developer laptops, have connections to your EC2 fleet, whether through APIs or SSH, is invaluable. The tool not only provides tangible evidence such as access and SSH keys, explaining why these assets can connect to your EC2 fleet but also enables a deeper analysis of the potential impact of compromised assets.
Imagine a scenario where a developer's laptop is compromised or stolen. With Security Graph, security teams can quickly determine the blast radius of this incident – identifying which assets in the cloud could be impacted due to this breach. This level of detail is crucial in understanding the potential scale of a security incident and in formulating a rapid and effective response strategy.
Furthermore, the Security Graph's insights into the connections between developer systems and specific workloads offer substantial visibility and control for SecOps teams. By identifying which developer systems are connecting to a particular workload, teams can enforce tighter security controls and monitor these interactions more closely. This capability is particularly beneficial in large, complex environments where tracking individual access patterns can be challenging.
.png?width=2832&height=1613&name=2%20(1).png) Figure 2 - Lateral movement possibilities
Figure 2 - Lateral movement possibilities
Use case 2: Pinpointing misconfigurations with zero trust score integration
Uptycs Security Graph excels in revealing misconfigurations, particularly those exposing resources to the internet. Its visual mapping of network paths and resources simplifies the detection and rectification of such vulnerabilities.
An integral part of this process is the incorporation of the Zero Trust Score, a metric that summarizes the misconfiguration status of the workload itself, beyond just the control plane. This score provides a comprehensive view of the security posture of each workload, taking into account various factors such as configuration settings, access controls, and compliance with best practices. By including both the workload and control plane misconfigurations in the Zero Trust Score, Security Graph offers a more complete and nuanced understanding of the security risks present in the cloud environment.
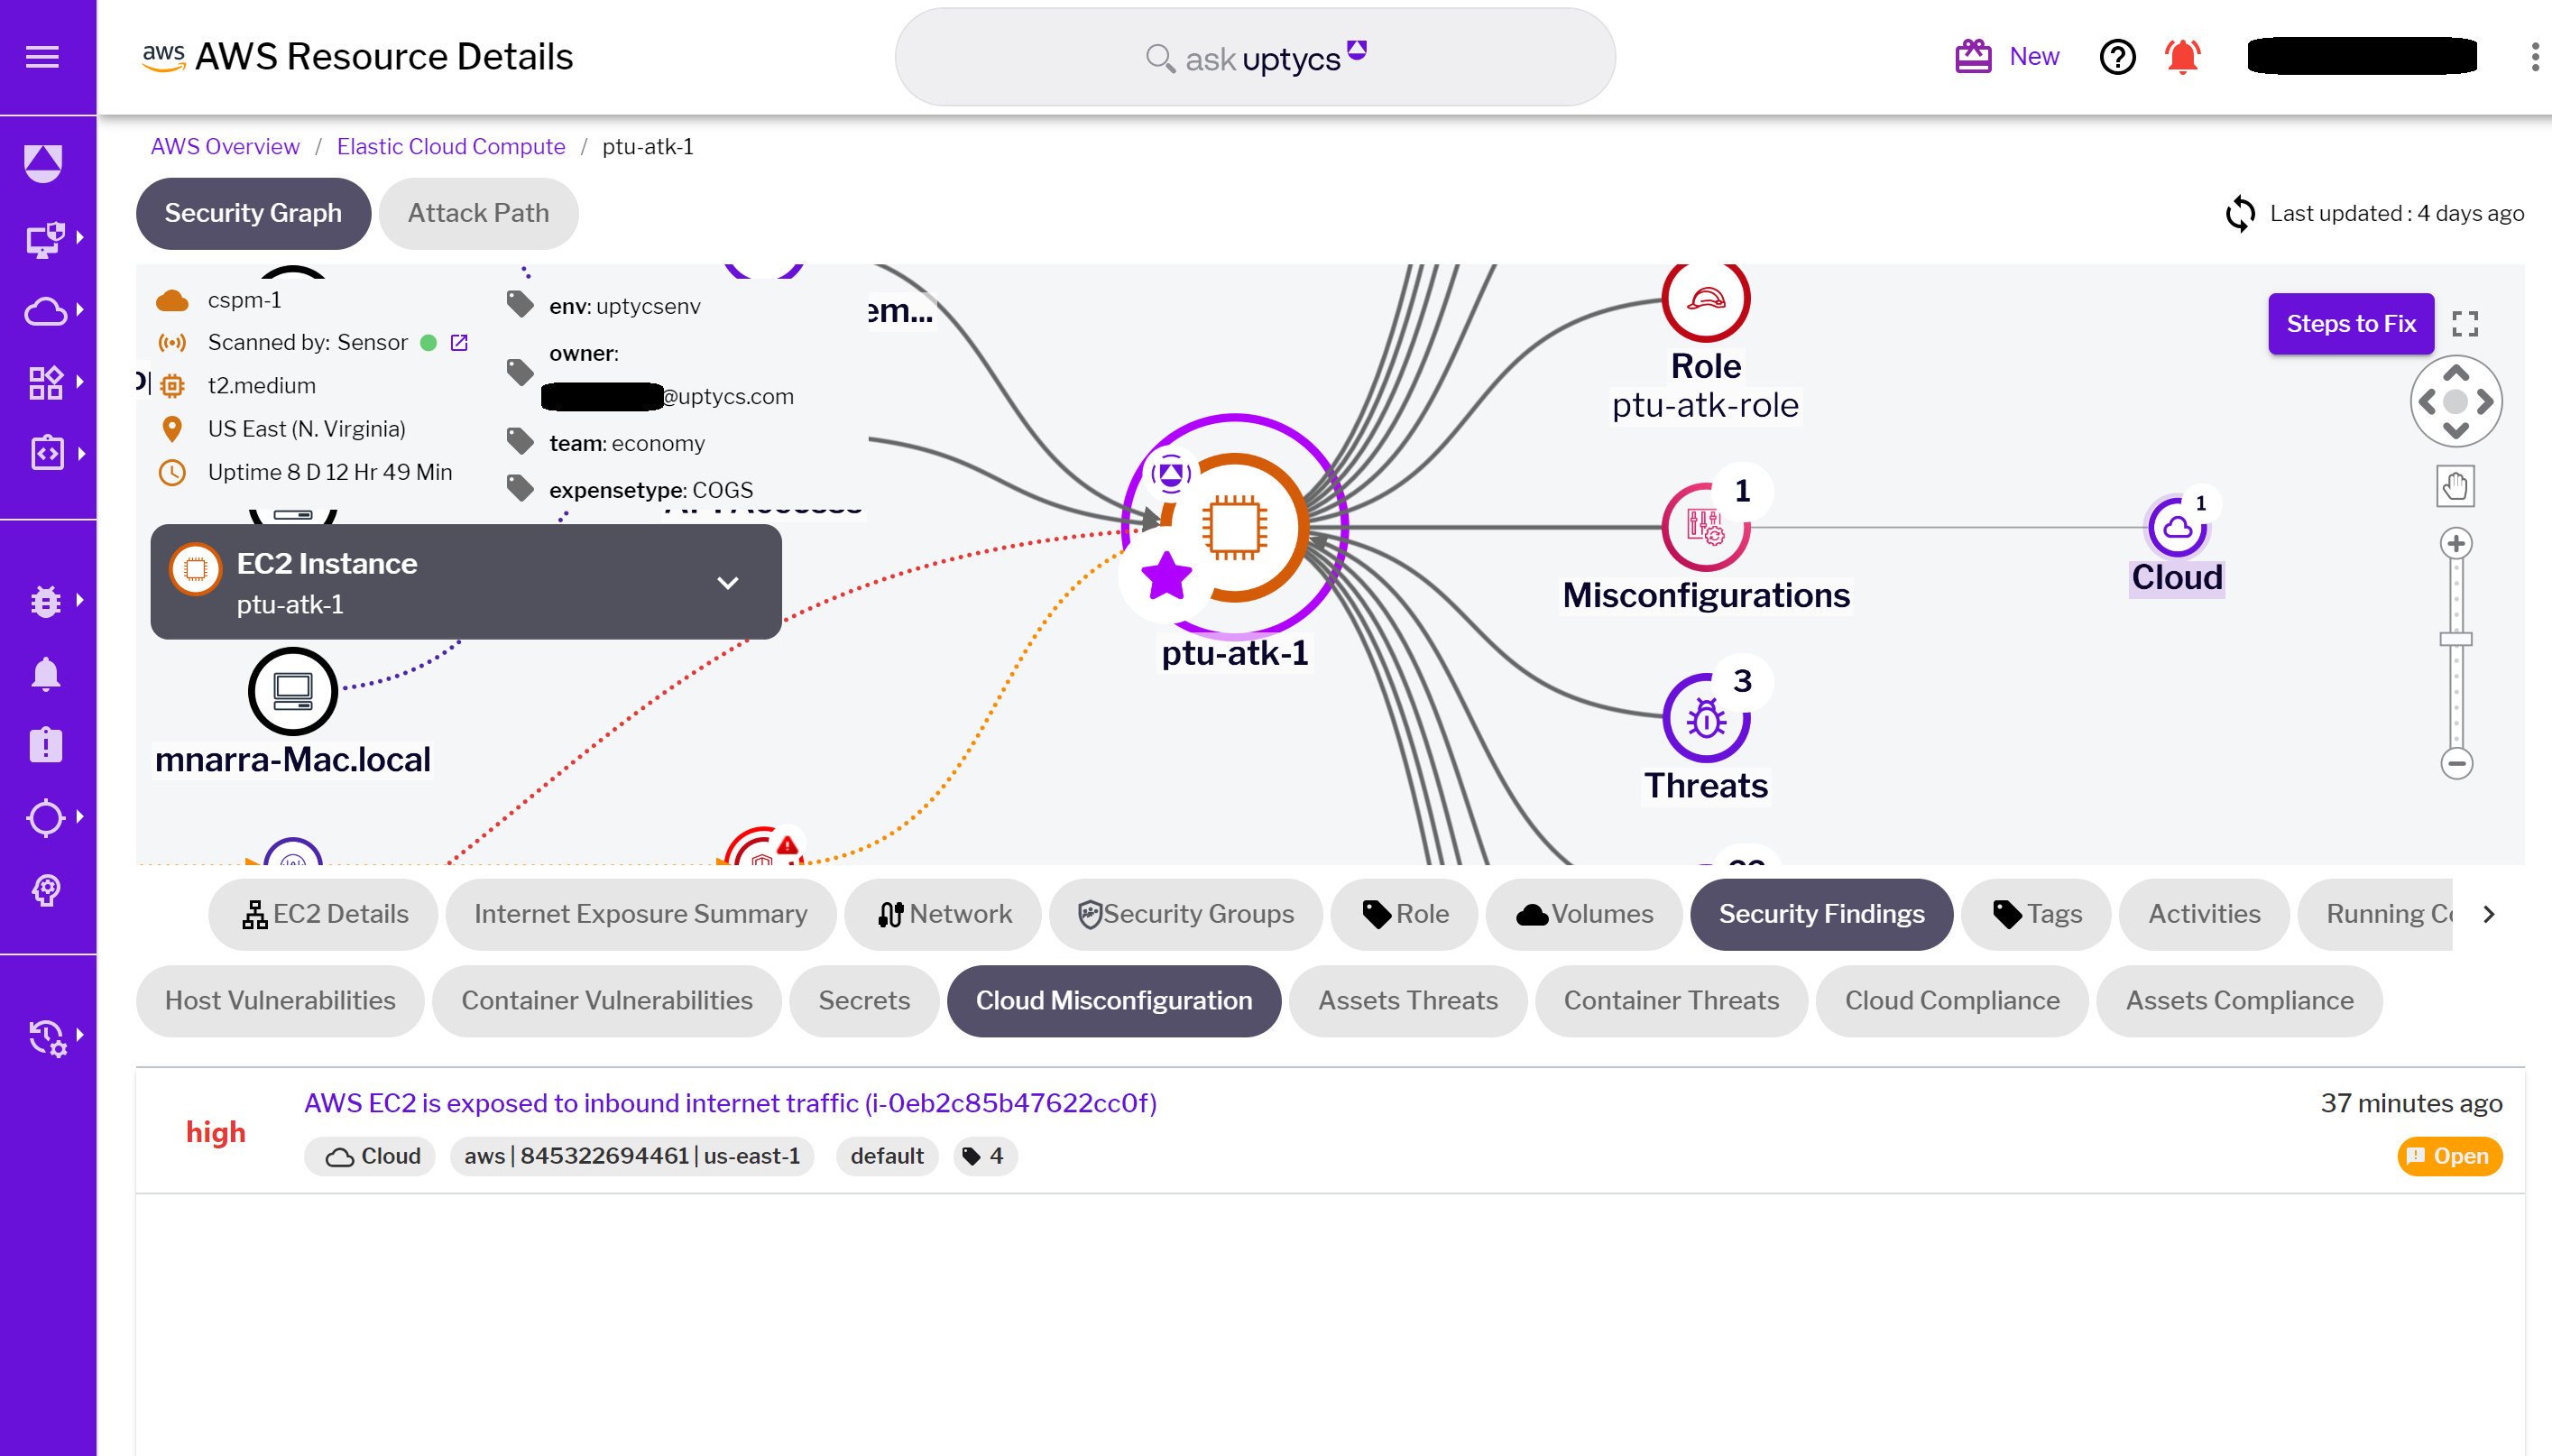 Figure 3 - Identified misconfigurations
Use case 3: Enhanced container security and vulnerability management
Uptycs Security Graph significantly strengthens container security and vulnerability management in cloud environments. This powerful tool provides a detailed view of all running containers on an EC2 instance, including essential information like hostname, image name, container state, and image ID. This level of detail is crucial for security teams, allowing them to thoroughly understand container activities and swiftly identify any irregularities or potential security risks.
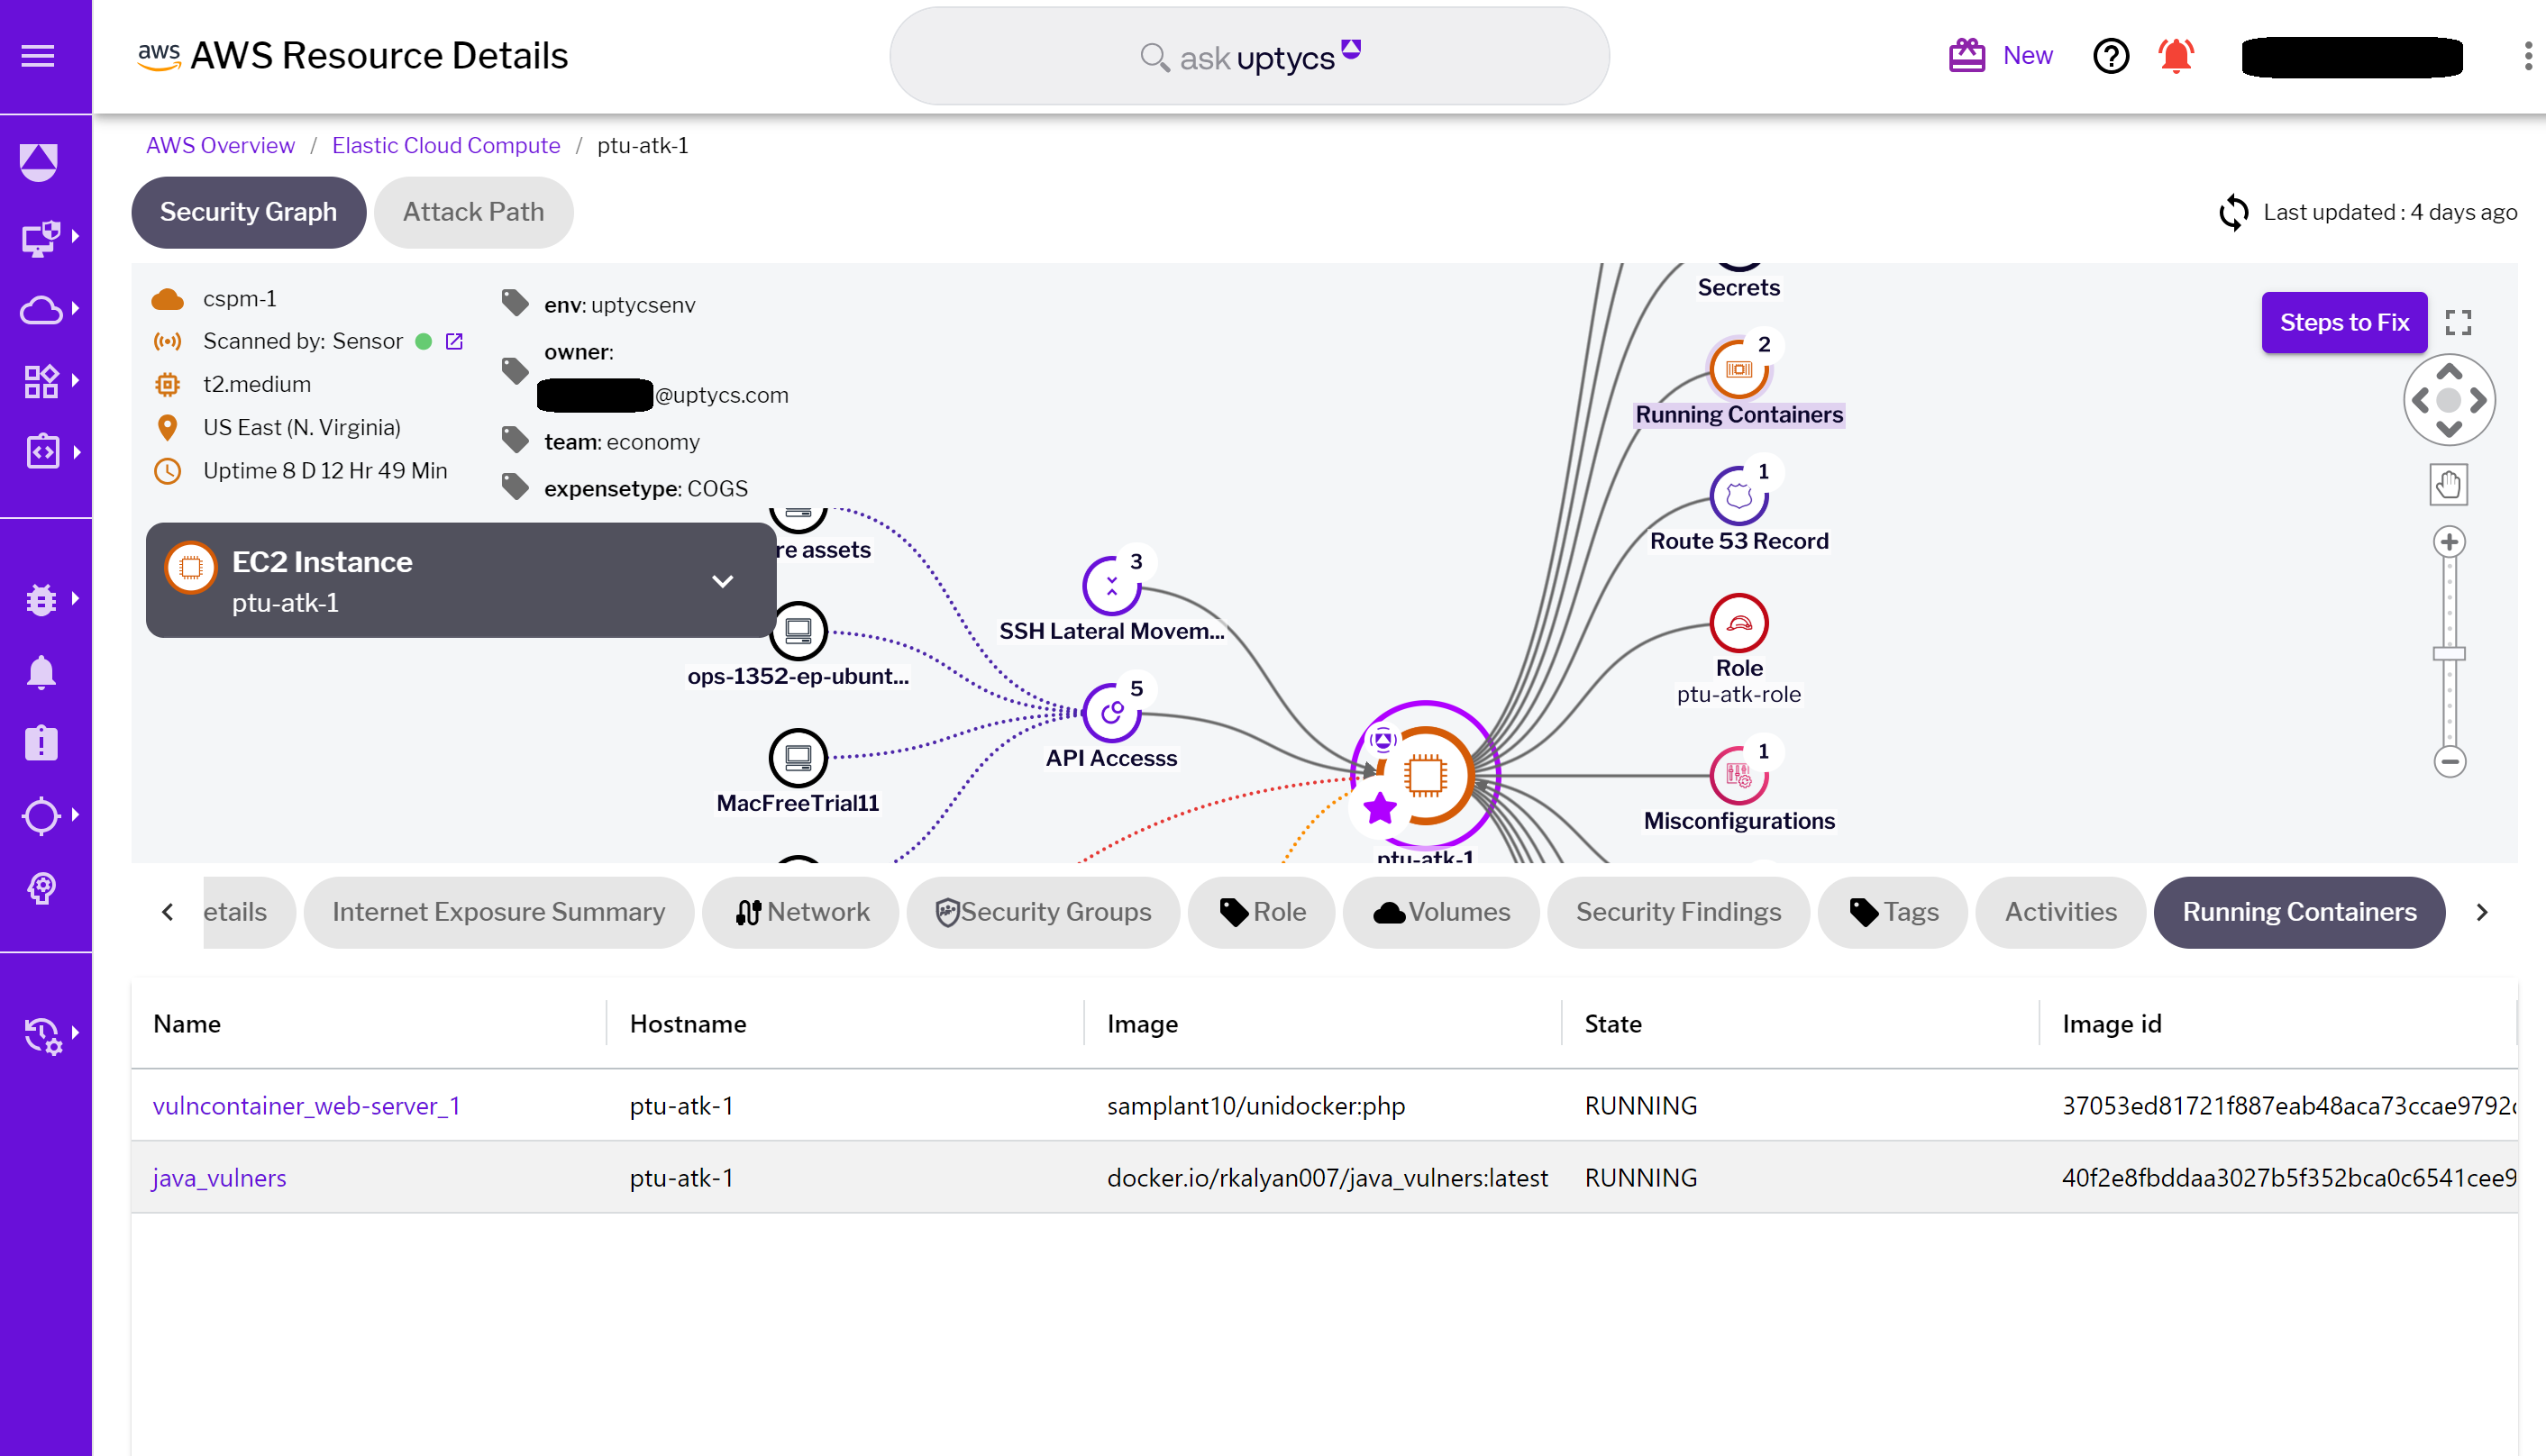 Figure 4 - Containers running on the EC2 instance
In addition to these insights, the Security Graph facilitates a seamless pivot to Kubernetes Security Posture Management (KSPM). This feature offers deeper insights into specific containers, enhancing the tool's effectiveness in managing container security. The integration of KSPM empowers teams to delve into the nuances of container behavior and security posture, ensuring a comprehensive approach to container management.
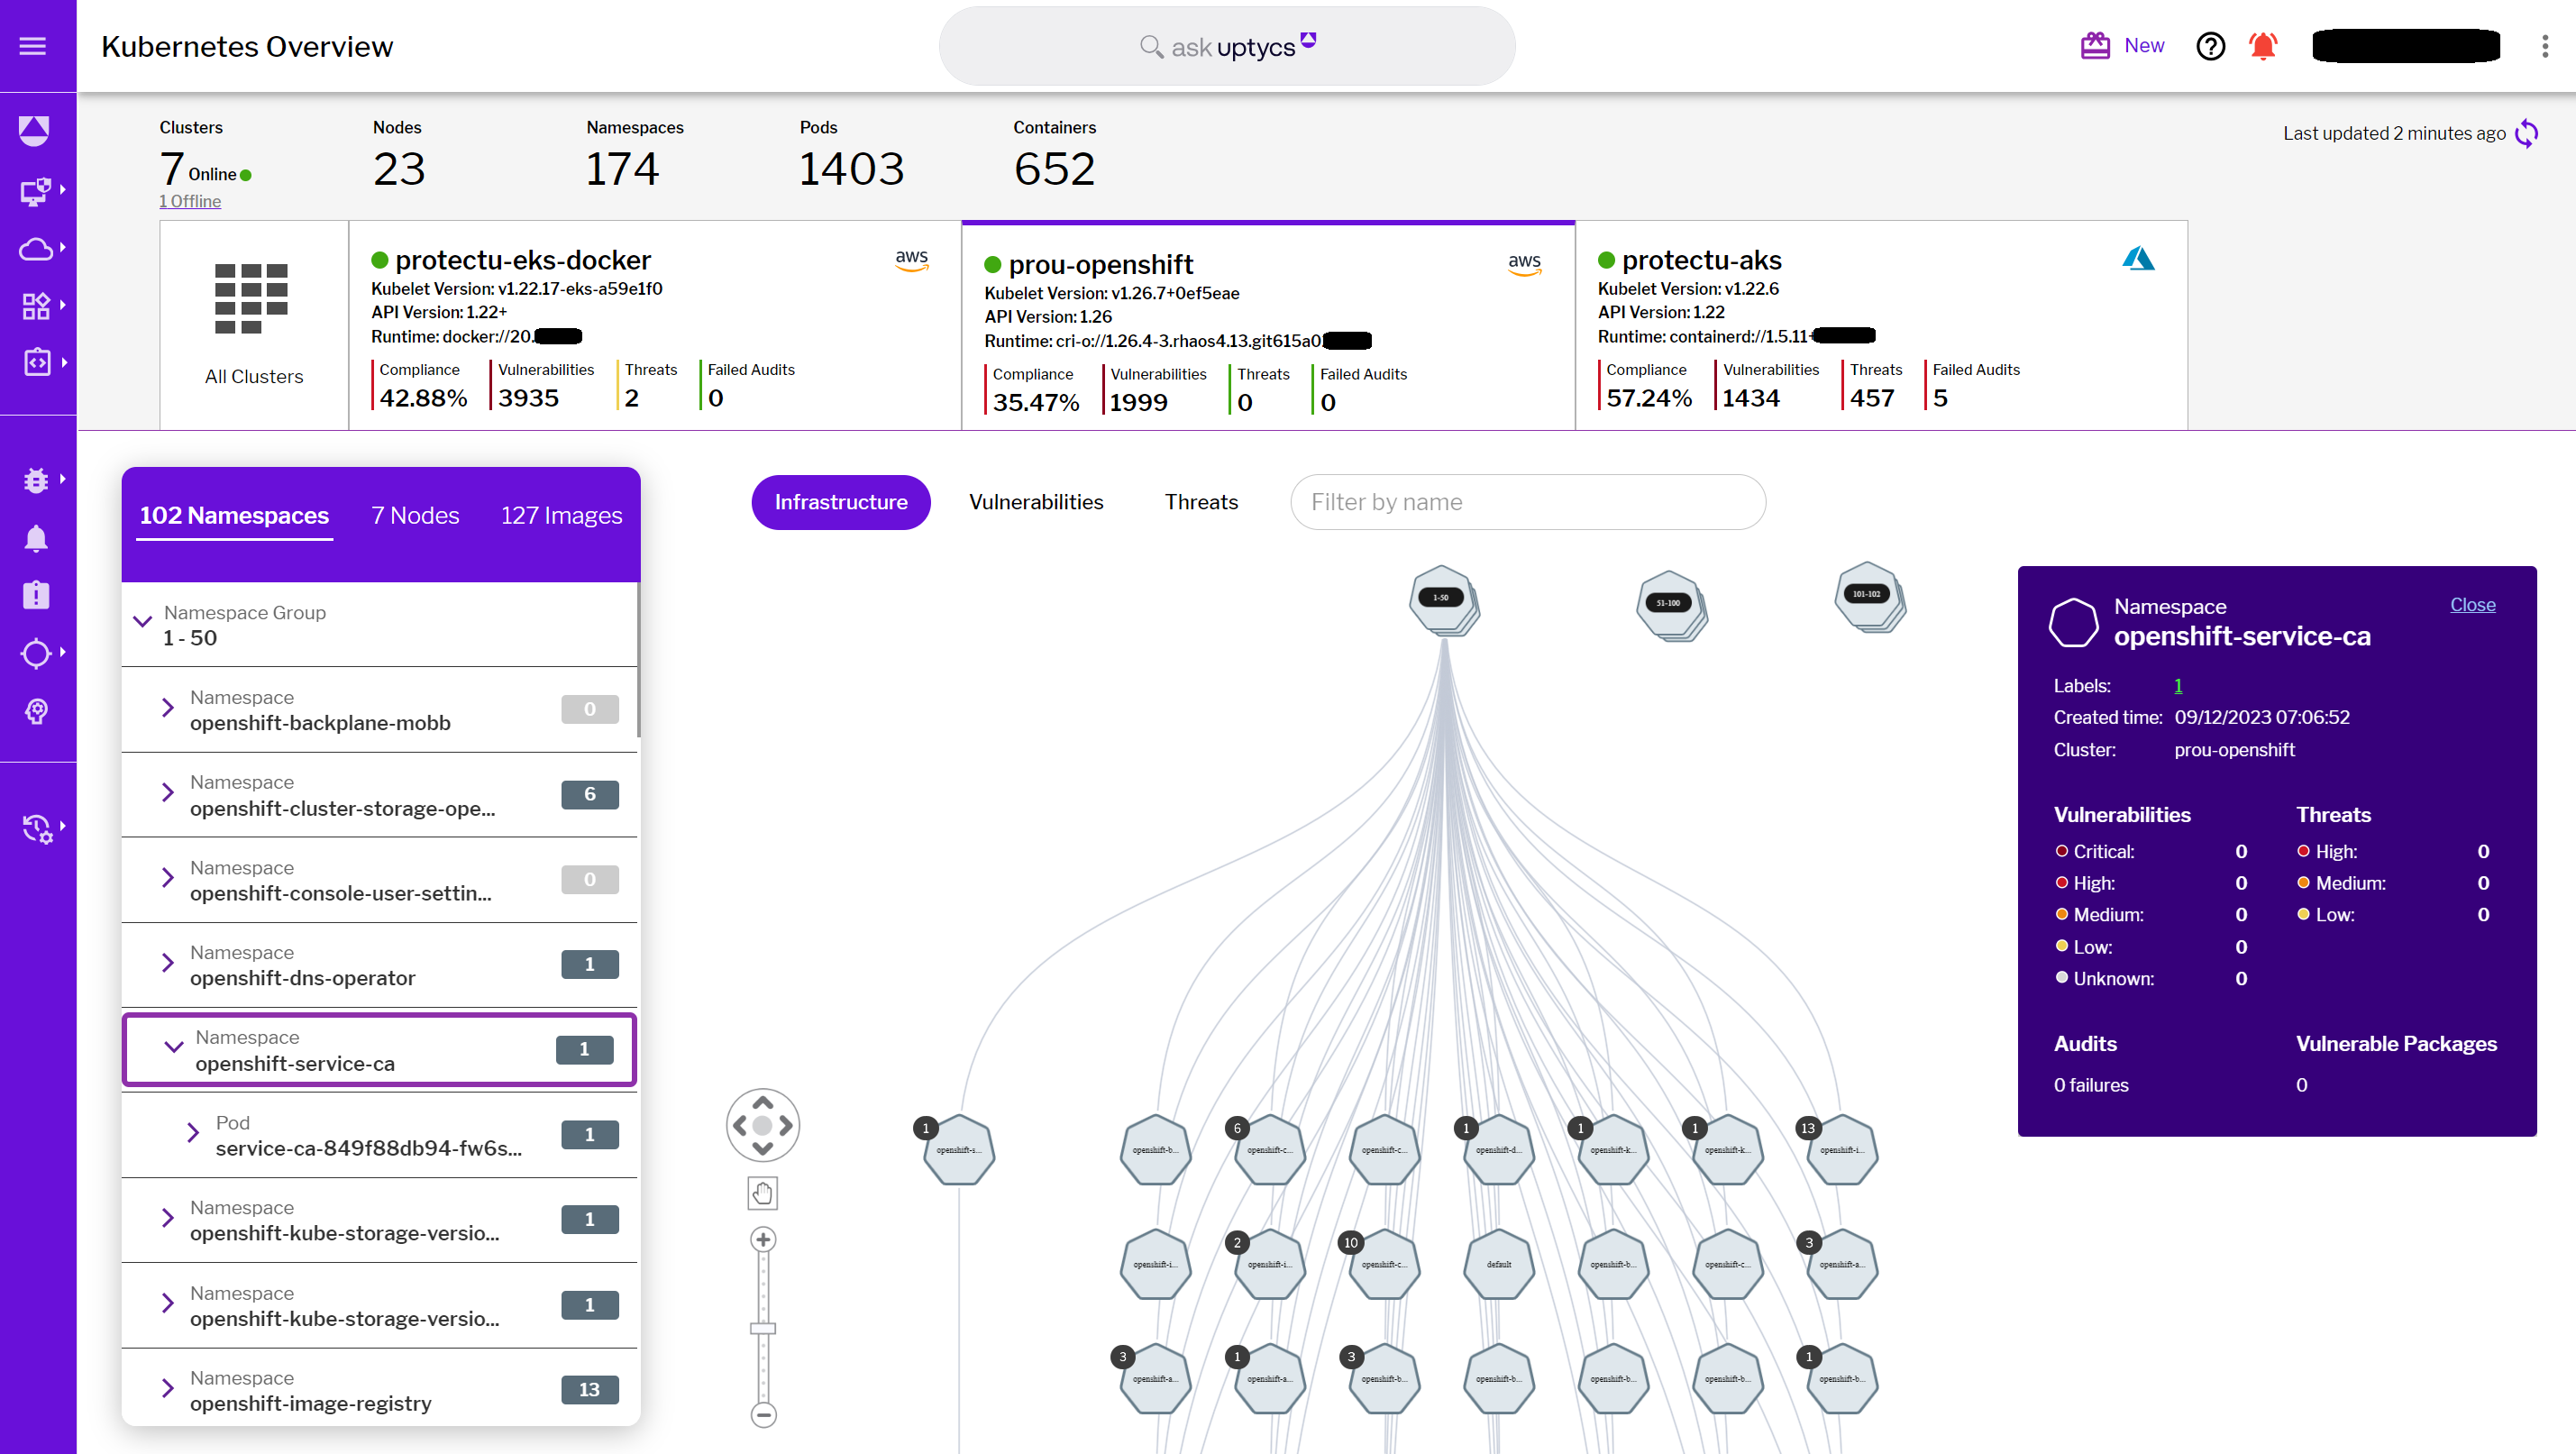
Figure 5 - KSPM overview highlighting containers & namespaces
Simultaneously, the Security Graph excels in comprehensive vulnerability management. It not only tracks vulnerabilities in containers but also covers host systems. This holistic view includes vital data such as CVE numbers, affected packages, CVSS scores, Uptycs scores, availability of fixes, and importantly, remediation guidance. By providing actionable intelligence on vulnerabilities across both containers and host systems, the Security Graph enables security teams to proactively address security weaknesses.
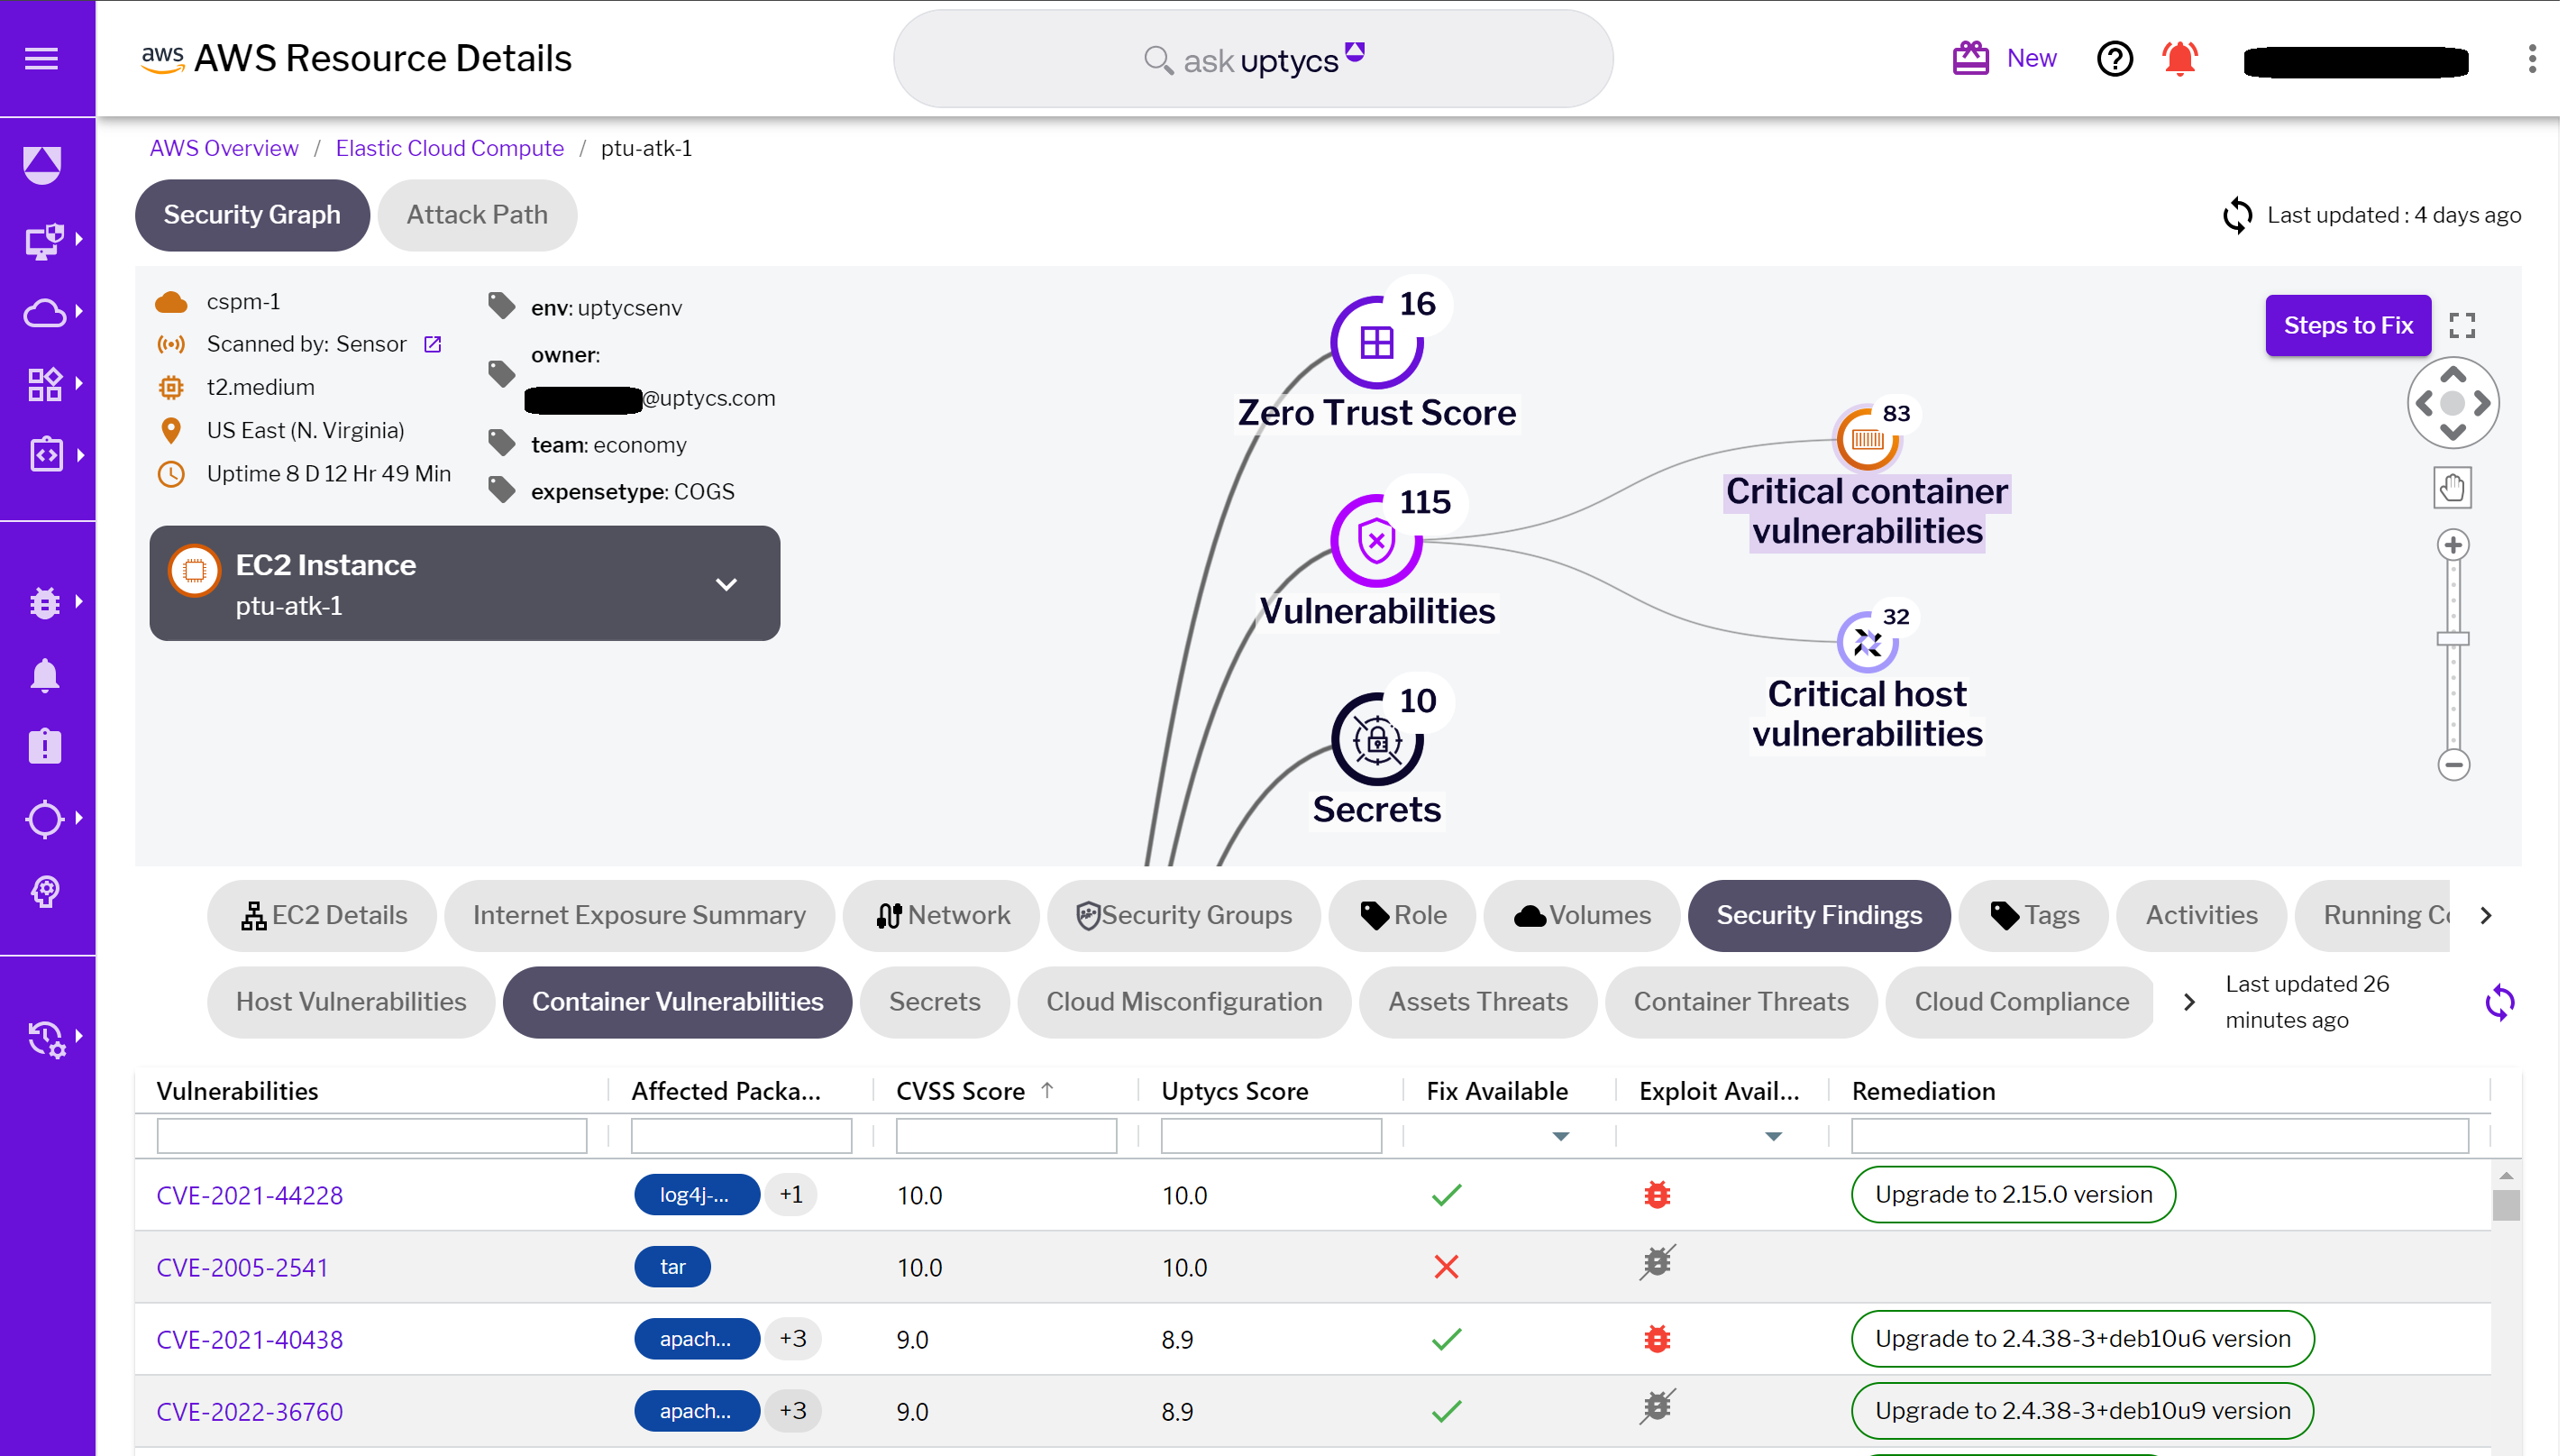 Figure 6 - Identified container vulnerabilities
This combined approach, offering both container insights and vulnerability management, empowers teams with a full spectrum of tools needed to enhance the security resilience of their cloud infrastructure. It ensures that security teams are not just reacting to threats but are proactively managing and mitigating risks in a dynamic cloud environment.
The Uptycs Security Graph introduces a vital use case, IAM Visibility, that enhances understanding and management of identity and access in cloud environments. This feature provides clear insights into identity access management (IAM) related to specific workloads.
- Identity-to-Workload Access: Security Graph can accurately display which identities have access to a particular workload. This visibility is crucial for ensuring that only authorized users or systems have the necessary permissions, bolstering the overall security posture.
- Cross-System Access Insights: In addition to showing access to individual workloads, Security Graph can also reveal the other systems that a particular identity can access. This broader view is essential for managing access controls and understanding the potential impact of an identity across multiple resources.
- Action Tracking: The tool goes a step further by offering insights into the actions performed by a given identity on a specific workload. Whether it's modifications, data access, or administrative actions, Security Graph provides a detailed account of these activities, allowing for more effective monitoring and auditing.
- Contextual Information Integration: All these features are integrated into the Security Graph, providing additional contextual information. This integration enhances the understanding of IAM within the cloud environment, ensuring that security teams can quickly assess and respond to any potential IAM-related risks.
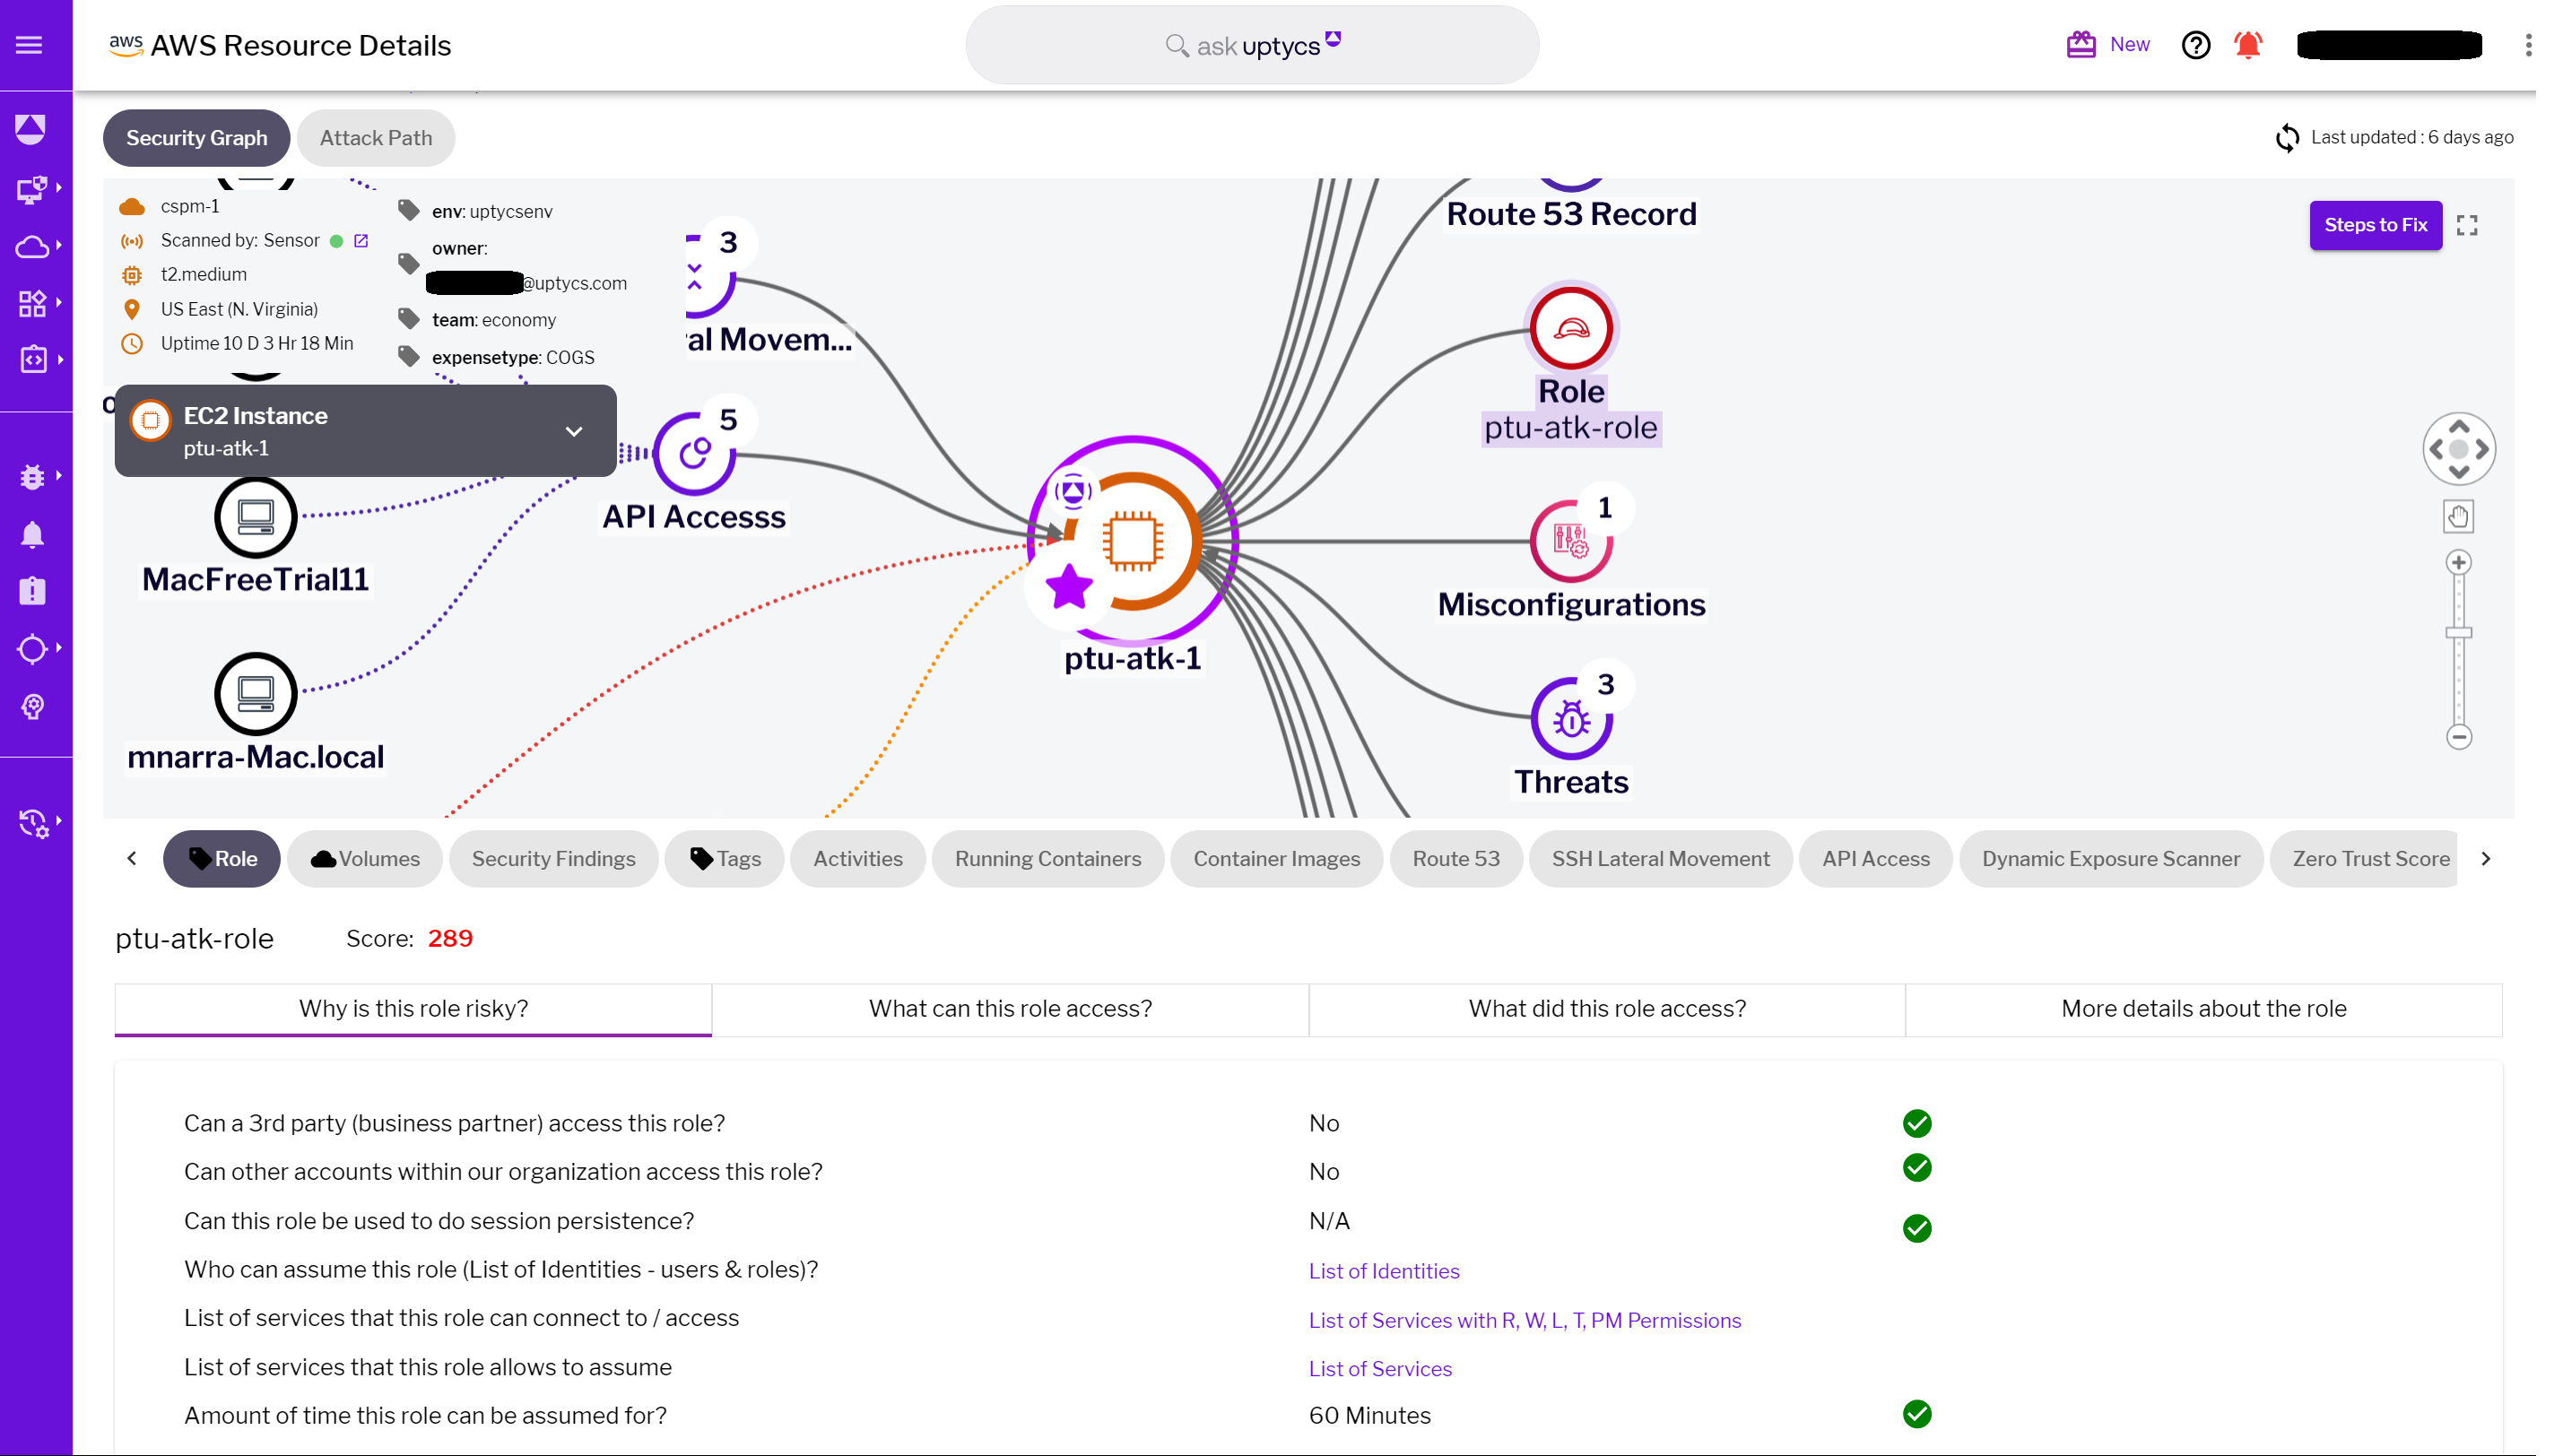
Figure 7 - IAM role metadata
The strategic advantage of Uptycs’ Security Graph
The absence of a tool like Security Graph can leave security teams in the dark, struggling to manage the complexities of cloud security and compliance. The Uptycs Security Graph, however, emerges as a significant time-saver and strategic asset. It transforms the convoluted task of security management into a streamlined, efficient process. By offering a unified view of security risks, rich information layers, simplified troubleshooting, informed decision-making, and compliance alignment, Security Graph empowers security teams to proactively manage challenges. Ultimately, it transforms cloud environments into secure, well-fortified digital fortresses, ready to face the evolving landscape of cyber threats.
Mastering Cloud Security #1: Understanding Attack Paths and Risk