
Osquery offers introspection capabilities for macOS that were previously difficult to achieve. Osquery uses a universal agent to collect and return a nearly unlimited amount of endpoint data that can then be queried like a database using SQL. For macOS system administrators, this opens up a world of quickly accessible system monitoring capabilities that support more effective system monitoring for Mac environments, which we'll explore here today.
In this post and video (click here to skip ahead to the video), we'll review some of the basic tasks for macOS system monitoring with osquery (osquery can be used for Linux and Windows as well, but because macOS was previously so underserved, I'm focusing there. Most commands we'll review will be the same or similar for other systems).
What we'll cover in this blog as part of practical system monitoring for Mac:
- Inventory Review
- Hard Disk Storage Remaining
- Disc Encryption Validation
- Processes and CPU
- Active Logins
- Vulnerability Check/ Installed Software Versions
Key Takeaways: System Monitoring for Mac Using Osquery
-
System monitoring for Mac can be done using simple SQL queries. Osquery exposes macOS system data in structured tables that you can query to retrieve inventory, storage, encryption, process, login, and software information.
-
Osquery makes macOS system data easier to access and analyze. Instead of relying on multiple native commands, administrators can use SQL to quickly retrieve human-readable results.
-
The same queries used locally can scale across enterprise environments. While this guide demonstrates interactive mode on a single Mac, the exact queries can be executed across a fleet with commercial infrastructure
These takeaways reflect exactly what the article demonstrates: six practical monitoring tasks using osqueryi in interactive mode.
Getting Started with System Monitoring for Mac Using Osquery
I've launched osquery in interactive mode using osqueryi. We'll be running these queries on a single machine today as we're looking at purely the open-source capabilities of osquery, but know that everything we're doing can also be done at scale across your entire enterprise with a commercial osquery solution.
Let's quickly look at the help command in the osquery shell by typing the command .help which lists out the other shell commands that are available in osquery. Initially, we're concerned with the mode command, which basically displays how your results are printed out on the screen. Most of the time you'll be using mode pretty, which formulates things in a normal SQL table. It tries to make this as "pretty" as possible in normal table, column, and header format. To do this, type the command: .mode pretty.
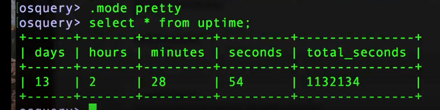
(Image: output in pretty mode)
There are times that you might want to use different modes, such as the line capability. Line will basically return each row out of a response from a table and then each column is put onto a new line. This can be helpful when you're working with tables that output only one row, like the Uptime Table, and sometimes it's easier to read them if you do this in the line format. You'll get more comfortable overtime and be able to adjust mode ahead of time depending on the tables and data you'll be working with.
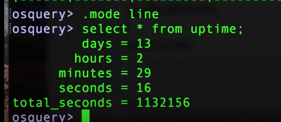
(Image: output in line mode)
Great, now let's jump into our basic system monitoring tasks.
Task 1: How Do You Perform an Inventory Review for System Monitoring for Mac?
Let's talk about the System Info Table. If you're familiar with 'About This Mac' on your Mac, the system info table does about the same on Mac OS. If you use the command select * from this you'll see personal information, such as the machine's name and serial number. For the purposes of inventory though, let’s set the display to .mode line, and then run this command:
| command: select cpu_type, cpu_subtype, cpu_brand, physical_memory, hardware_vendor, hardware_model, hardware_version, from system_info; |
and you'll get back something like this:
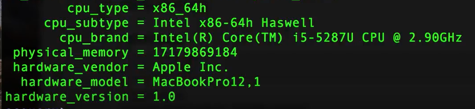
(Image: sample output for inventory)
Add in the serial number column (excluded from our example for obvious reasons) and you have a method for tracking and inventorying unique Macs. You can also just type in command: select * from system_info; and get all the available options.
Task 2: Remaining Hard Disk Storage for System Monitoring for Mac
First, let's go back to .mode pretty so we can view our results in a table. Then, let's check out the table in osquery called Mounts, which lists all the file mounts. Like a lot of tables in osquery, you'll initially see a fair bit of information.
By exploring some SQL refinements, we can reduce the output noise and transform the output values to more exacting results which is the command we'll look at here. For those of you curious about the refinement and transformation process, watch the corresponding video at about the 5-7 minute mark to see exactly what we did. (Teaser, it involves handy math shortcuts with SQL.)
| command: select path, type, round((blocks_available * blocks_size *10e-10),2) as gigs_free from mounts where path='/'; |
This returns a neat little report showing what the root directory is, what type of file system it is, and how many gigs are free.
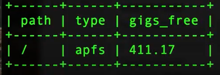
(Image: sample output for remaining gigs of storage)
Task 3: How Do You Validate Disk Encryption on macOS?
Are your discs encrypted? Let's look at the disk_encryption table in osquery to find out. We'll even join that table with the mount_type table which we used above so we cannot only see how many gigs are free, but whether the partition is encrypted and what type of encryption it's using, etc.
I've done a lot of refinement of this query again to reduce the noise and produce the most relevant output. If you're interested in learning how we go here, check out the corresponding video from about 7:30-8:30 minutes.
| command: select m.path, m.type as mount_type, round((m.blocks_available * m.blocks_size * 10e-10) ,2) as free_gigs, de.encrypted, de.type from mounts m join disk_encryption de on de.name=m.device where m.path ='/'; |
You've now got the ability to do a report that shows what our main file partition is, what type of file partition it is, how many gigs free we have, and whether it's encrypted it is or not and if it is encrypted, what type of encryption it's using. Output sample below:
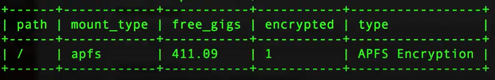
(Image: sample osquery output for disk encryption)
Again, if you do this at scale, you can basically survey all the Macs that are in your fleet and be able to tell what's going on with all of their hard drives with this one simple command.
Task 4: Processes & CPU for Mac System Monitoring
The "processes" table in osquery can help you to uncover whether a specific process is taking up too much memory at a point in time as well as the processes that are routinely taking up a lot of memory or processor. This is akin to using the ps command, except that you have the ability to shape it through SQL rather than having to remember all the command flags.
To see processes sorted by system time, run this command:
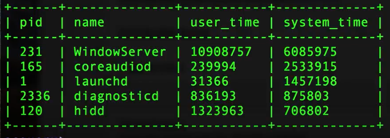
| command: select pid, name, user_time, system_time from processes order by system_time desc limit 5; |
What we're asking in this command is to pull the process ID, the name of the process, and how much processor time, both in user mode and system mode, it's using. Since we're concerned about the one that's using the most system time, we've also ordered the output by system time descending and then limited this to five results for simplicity's sake. Here's an example of that output:
(Image: sample sys monitoring with osquery for process and cpu)
To see processes by combined system & user time, run this command:
| command: select pid, name, user_time, system_time from processes order by (user_time + system_time) desc limit 5; |
To see processes by total size (RAM + disc memory), run this command:
| command: select pid, name, round((total_size * 10e-7) ,2) as mem_in_megs from processes order by total_size desc limit 5; |
We're rounding the memory number (round), converting to megabytes (10e-7) and limiting to two decimal points (,2) so that the output is more friendly to the human eye. Here's an example:
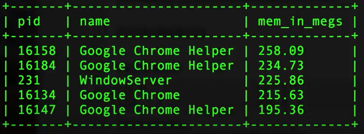
(Image: sample osquery output for total memory)
You can see that Google Chrome and associated Helper processes are currently taking up the top slots for memory used.
Task 5: Active Logins for System Monitoring for Mac
In order to identify suspicious or unknown logins, you need to know who's currently logged into your machine(s). On a desktop, this is not necessarily as critical as a server, but you definitely do want to know if a new user pops up and is doing something that you don't expect to be there. To do this, we'll look at the logged_in_users table.
| command: select * from logged_in_users where type ='user' ; |
Here's an example of that output:
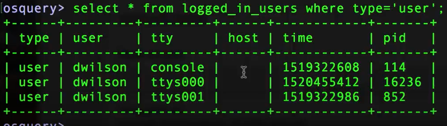
(Image: sample sys monitoring with osquery for active users)
If you happen to be doing this on a server or you're doing this on your local desktop and somebody is logged in remotely, the host column will actually show where the remote connection is coming from which is very helpful.
Task 6: How Do You Check for Vulnerabilities and Software Versions on macOS?
Administrators commonly need to look at what software is on a given machine. A lot of times, you might have vulnerability scanning software that's involved, or some inventory control software that's bulky to use when you just want to check one particular item. Osquery allows you to do this easily on the fly. In other videos we'll talk about how you can check application versions at scale with osquery, but here we’ll show how you could do a quick spot check to answer a specific question.
On a Mac, you can look at any of the installed apps with the apps table. Let's say that Chrome browser that we learned was using up all that memory earlier (see Task 4: Processes and CPU), I want to make sure that I have the latest version installed. We're going to use the like operator, which allows us to look for the Chrome string with some wildcards (%chrome%), since we may not know the exact app name, and we'll see what we get.
[check out this post for more info on using wildcards in osquery]
| command: select diplay_name, bundle_short_version, bundle_version from apps where name like '%chrome%' ; |
I've done some scrubbing of the command above. If you're curious to see more of the refinements we've made to help understand some of the nuances of SQL, fast forward this accompanying video to the 16 minute mark. Here's an example of the output from our command above:
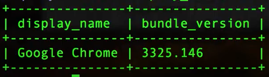
(Image: sample osquery output for version installed)
Now, if there was an active report of a compromised version of Google Chrome, you'd very quickly be able to tell if your systems were impacted and needed any updates or remediation without having to wait for researchers or a signature update.
Wrapping up & Some Shortcuts
We've covered several things today about macOS system monitoring with osquery and how it strengthens system monitoring for Mac environments. Although our examples focused on what you can do locally on a machine with the open source version of osquery, remember that all of these can be done at scale with the proper infrastructure, allowing you to query your entire fleet with a single command. The six basic system monitoring tasks we covered here are just scratching the surface of what is possible for administration and system monitoring for Mac using osquery.
Below, I've included a reference chart for the SQL queries we used as well as a video tutorial so you can see all of these tasks carried out first hand.
|
|
;OSQUERY TABLE |
MODE |
SQL COMMAND |
| Inventory Review | system_info | .mode line | select cpu_type, cpu_subtype, cpu_brand, physical_memory, hardware_vendor, hardware_model, hardware_version, from system_info; |
| Hard Disk Storage Remaining | mounts | .mode pretty | select path, type, round((blocks_available * blocks_size *10e-10),2) as gigs_free from mounts where path='/'; |
| Disk Encryption Validation |
disk_encryption |
.mode pretty | select m.path, m.type as mount_type, round((m.blocks_available * m.blocks_size * 10e-10) ,2) as free_gigs, de.encrypted, de.type from mounts m join disk_encryption de on de.name=m.device where m.path ='/'; |
| Processes and CPU > system run time |
processes | .mode pretty | select pid, name, user_time, system_time from processes order by system_time desc limit 5; |
| Processes and CPU > system + user time |
processes | .mode pretty | select pid, name, user_time, system_time from processes order by (user_time + system_time) desc limit 5; |
| Processes and CPU > RAM + disk memory |
processes | .mode pretty | select pid, name, round((total_size * 10e-7) ,2) as mem_in_megs from processes order by total_size desc limit 5; |
| Active Logins | logged_in_users | .mode pretty | select * from logged_in_users where type ='user'; |
| Vuln Check/ Installed Versions | apps | .mode pretty | select diplay_name, bundle_short_version, bundle_version from apps where name like '%insert app name%' ; |
The video below includes all of the tasks we walked through above in addition to more of my step by step thinking where we did some significant SQL refinements to reduce output noise and modify data points to be more human friendly. It's helpful for learning, so I'd encourage you to watch if you've got a few extra minutes.
Check out more osquery tutorial videos on our YouTube channel.
Video: macOS system monitoring with osquery - 6 basic admin tasks
I hope the information included here will give you some inspiration and encouragement to try other ways to use osquery for macOS system monitoring. You can see the flexibility of how osquery plus SQL can allow you to ask questions and get answers easily. If you've got a tip for macOS system monitoring with osquery you'd like to share, please leave a comment below.
Learn more about osquery:
Frequently Asked Questions About System Monitoring for Mac Using Osquery
1. What is system monitoring for Mac?
System monitoring for Mac is the process of collecting and reviewing endpoint data such as hardware details, disk space, encryption status, running processes, active users, and installed software. In this guide, monitoring is performed using Osquery and SQL queries on macOS.
2. How does Osquery perform system monitoring on macOS?
Osquery exposes macOS system information as database tables. Administrators can run SQL queries against tables such as system_info, mounts, disk_encryption, processes, logged_in_users, and apps to retrieve real-time system data.
3. How can I check remaining disk space on a Mac using Osquery?
You can query the mounts table and calculate available space using SQL. The blog demonstrates selecting the root path and converting available blocks into gigabytes for easier readability.
4. How do you validate disk encryption on macOS with Osquery?
Disk encryption status can be checked by querying the disk_encryption table and joining it with the mounts table. This shows whether a partition is encrypted and what encryption type is in use.
5. How can I monitor CPU usage and memory usage on macOS?
The processes table allows you to sort processes by system time, combined user and system time, or total memory size. This helps identify which processes are consuming the most CPU or RAM.
6. How do you check installed software versions on macOS using Osquery?
You can query the apps table and use the SQL LIKE operator to search for specific applications. This allows administrators to verify installed versions and quickly determine whether systems may be running outdated software.