
The Uptycs Threat Intelligence team is responsible for providing a high quality, curated, and current Threat Intelligence feed to the Uptycs product. In order to deliver the threat feed, the team evaluates every single alert that is seen by our customers, and investigates the alert as feedback into the threat feed curation process.
Recently we observed a malicious domain alert from a customer. The out-of-the-box alert description indicated that it belonged to the OSX/Shlayer malware family. We were quickly able to query Uptycs threat intelligence to find that the domain first appeared on February, 2019 and was reported by multiple threat intel sources.
Once the threat was validated, we dove into deeper investigation to understand the threat surface and risk. This post walks through the steps and techniques we performed to analyze data that had been collected via osquery, and aggregated in Uptycs.
First, some context: Uptycs provides an out of the box integration with third-party threat intelligence. We have more than 6 million indicators in 8 different categories. In addition to historical scanning (which is mostly invoked manually), Uptycs also scans DNS and IP connections in real time to identify malicious connections.
Now, let's dig in.
We received an alert on ‘api.inettasks.com’ domain as shown in figure 1.
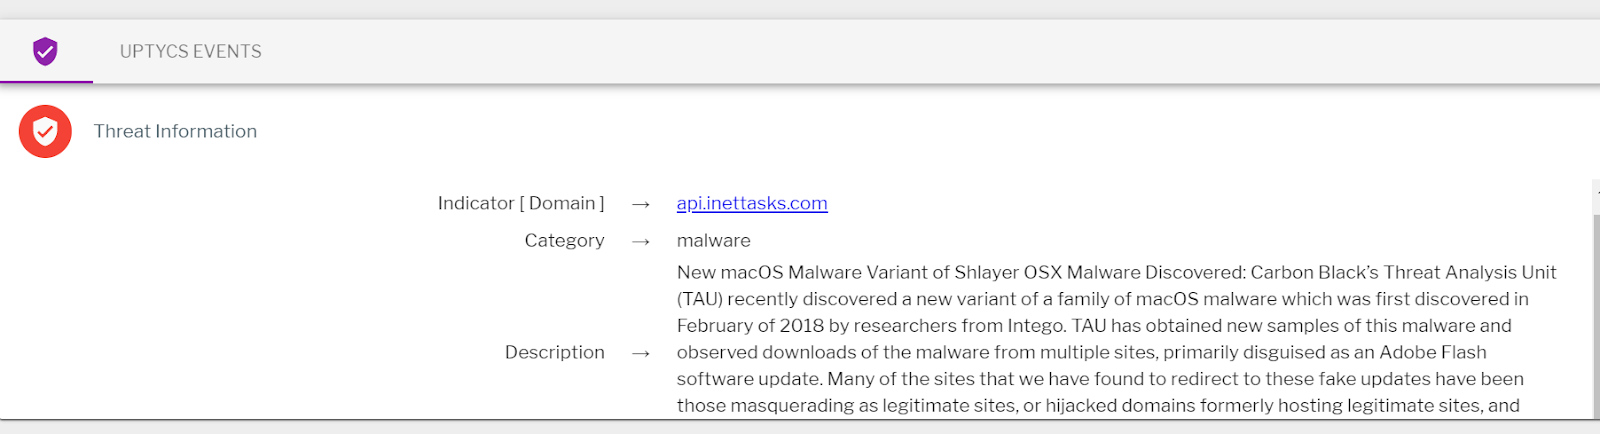
At the time of alert we knew from the description that it belongs to OSX/Shlayer malware, and the specific number of machines that were identified as infected with the malware. Uptycs captured the following events:
- DNS lookup events
- Socket events
- Process events
So our first step is to identify the event time and source IP Address for the domain query that triggered the alert. We can use the following query to get this information:
Upt_day is an integer value of day in yyyymmdd format. It can be used to improve query performance. We can use this information to get the process name that made the DNS query.
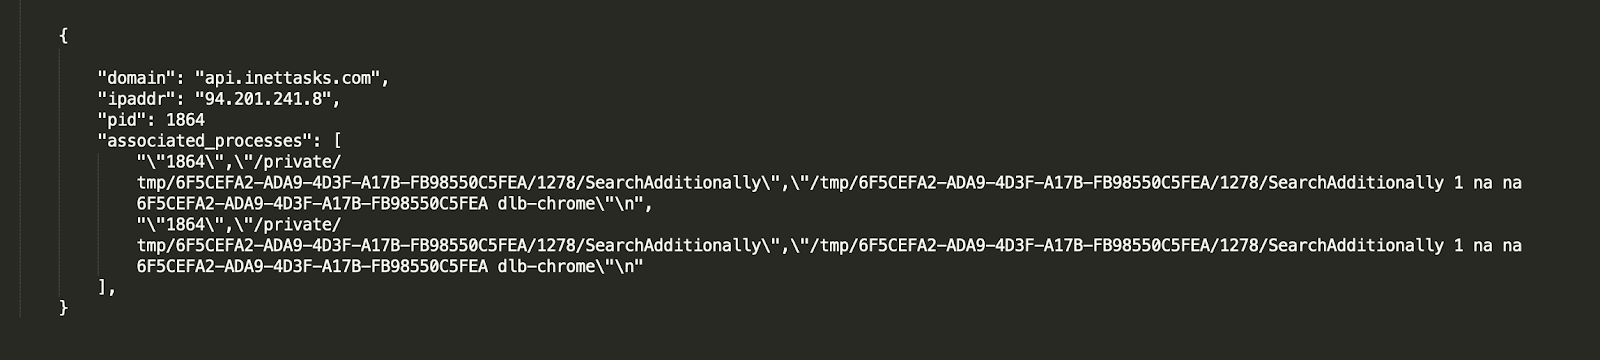
The following queries get us the process name as shown in figure 2:
SELECT pid from process_open_sockets p where p.remote_address = 'value from above query' and p.upt_day >= same value as above query and p.upt_asset_id = 'value from above query'"
And
"SELECT pid, path, cmdline from processes p where p.pid = value from above query and p.upt_day >= same as above query and upt_asset_id = 'value from above query'"
In some cases, over time, the same pid (process id) can be associated with multiple processes. In that instance, we can use socket events:
"SELECT pid, upt_asset_id, upt_hostname, time, path from socket_events where remote_address = ‘ip address from 1st query’' and upt_day >= same as 1st query and time > ‘value from 1st query’ and time < ‘value from 1st query’"
Note that in the above query we have drilled down to the actual time of events. In the first query we received the DNS lookup event time, enabling us to now use a 3 or 5 minute window to get more precise results.
The above queries will provide the information about the domain that triggered the alert like IP address, process name, and process id. While it is relevant information, it doesn’t provide the full picture of what happened on the machine. To build the entire process tree, we need to pull all of the process events during the DNS lookup time frame. To do that, we can use the following query:
"SELECT * from process_events where time > ‘value from 1st query’ and time < ‘value from 1st query’ and upt_asset_id = value from 1st query' and upt_day >= same as first query"
In this query we can capture the events that happened within five minutes of the DNS lookup event that triggered the alert. Those 5 minutes can capture both a before and after window, for example, 2 minutes before the dns lookup and 3 minutes after.
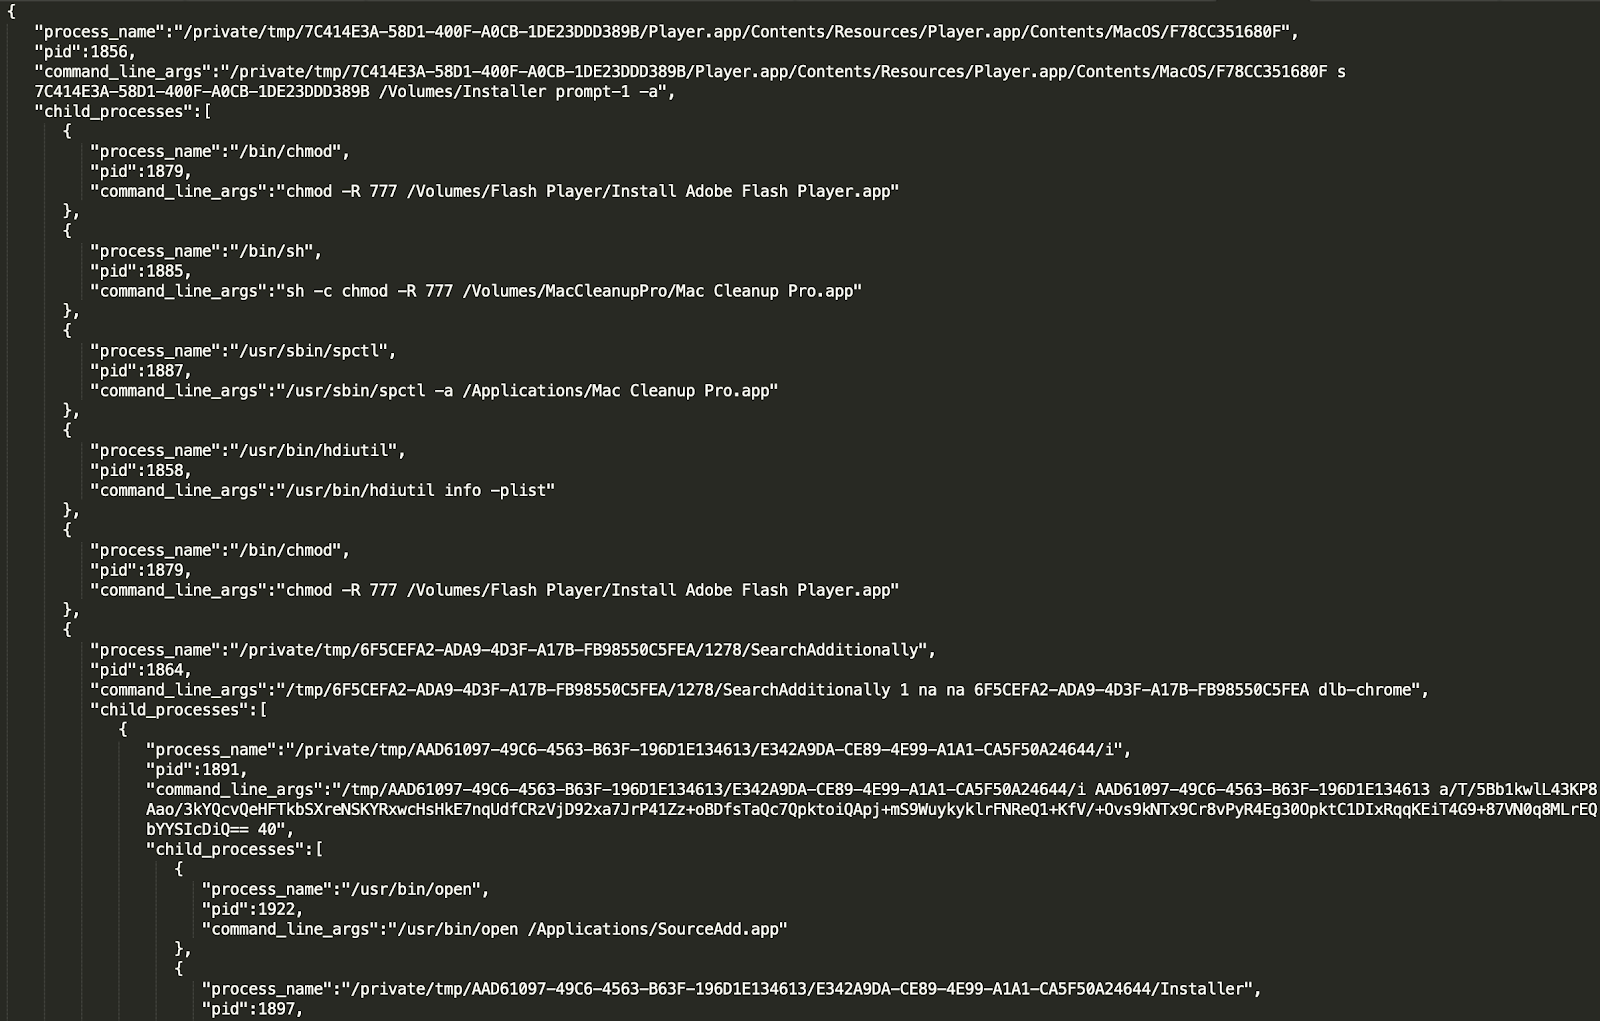
Using this script, a process tree can be constructed to provide a detailed picture of the infection. A snippet of the process tree is shown in figure 3.
The above investigation not only identifies the surface of the infection, but also helps to validate the authenticity of the alert. For comparison, consider the case of a web gateway, the alert from the web gateway doesn’t provide any information about the infection on the endpoint.
The alert may simply be the result of browsing activity in which the endpoint might not actually be infected. The combination of integrated threat intelligence along with actual endpoint state aides in prioritization and quick access to the detailed data needed for investigation.
.png?width=672&name=Threat%20Hunting%20with%20osquery%20Webinar%20(Banner).png)
Related osquery resources: