Since Log4Shell was first disclosed on December 9th, Uptycs has been helping customers address gaps in their security and gain unparalleled visibility into their endpoints and cloud workloads. In support of the security community, we are excited to announce that we are offering a free service to inventory and track Log4j using Uptycs’ osquery-based agent! Enrollment is easy: first submit the initial details needed for Uptycs to create your SaaS tenant, then after the initial tenant setup you can deploy the software and scan up to 5,000 hosts or containers in under 20 minutes.
Over the past three months, the security community has come together in a motivating show of force to address Log4Shell. With no commitments or gimmicks, we want to continue that collaborative spirit and help security teams to gain the confidence that you did in fact truly capture all the Log4j instances in your environment and have left no stone unturned. All that’s needed is a valid company email address.
Keep reading to learn about the tool we built to make inventorying Log4j easy and scalable for thousands of endpoints. See real-time data as Uptycs scans your fleet for Log4j instances, including uber and shaded .jar files. Whether you’re struggling at the discovery, remediation, or continuous monitoring phase, this free trial gives you that extra visibility and confidence that you have addressed every instance of Log4j.
Stronger Together, Uptycs First Response
When Log4Shell was first disclosed, our large customers came to Uptycs asking for assistance in inventorying Log4j across their laptop, server, and container fleets. Our team quickly built a way to scan over a million hosts in under 20 min, to support these clients that need real-time answers from across hundreds of thousands of endpoints.
Taking this even further, Uptycs has the ability to create custom dashboards that leverage query packs. We built and pushed out a specific Log4j Vulnerability dashboard that tracks Log4j instances across your Windows, Linux, macOS, and container workloads, giving you layers of insight from a top-level view of your IT ecosystem down to understanding what specific assets, images, and even command lines are returning vulnerable versions of Log4j.
The trial we are offering is based on that Log4j dashboard we developed for our own customers. We saw the usefulness and clear value added from osquery’s powerful capabilities to ask questions and get answers quickly.
Breaking Down the Free Assessment
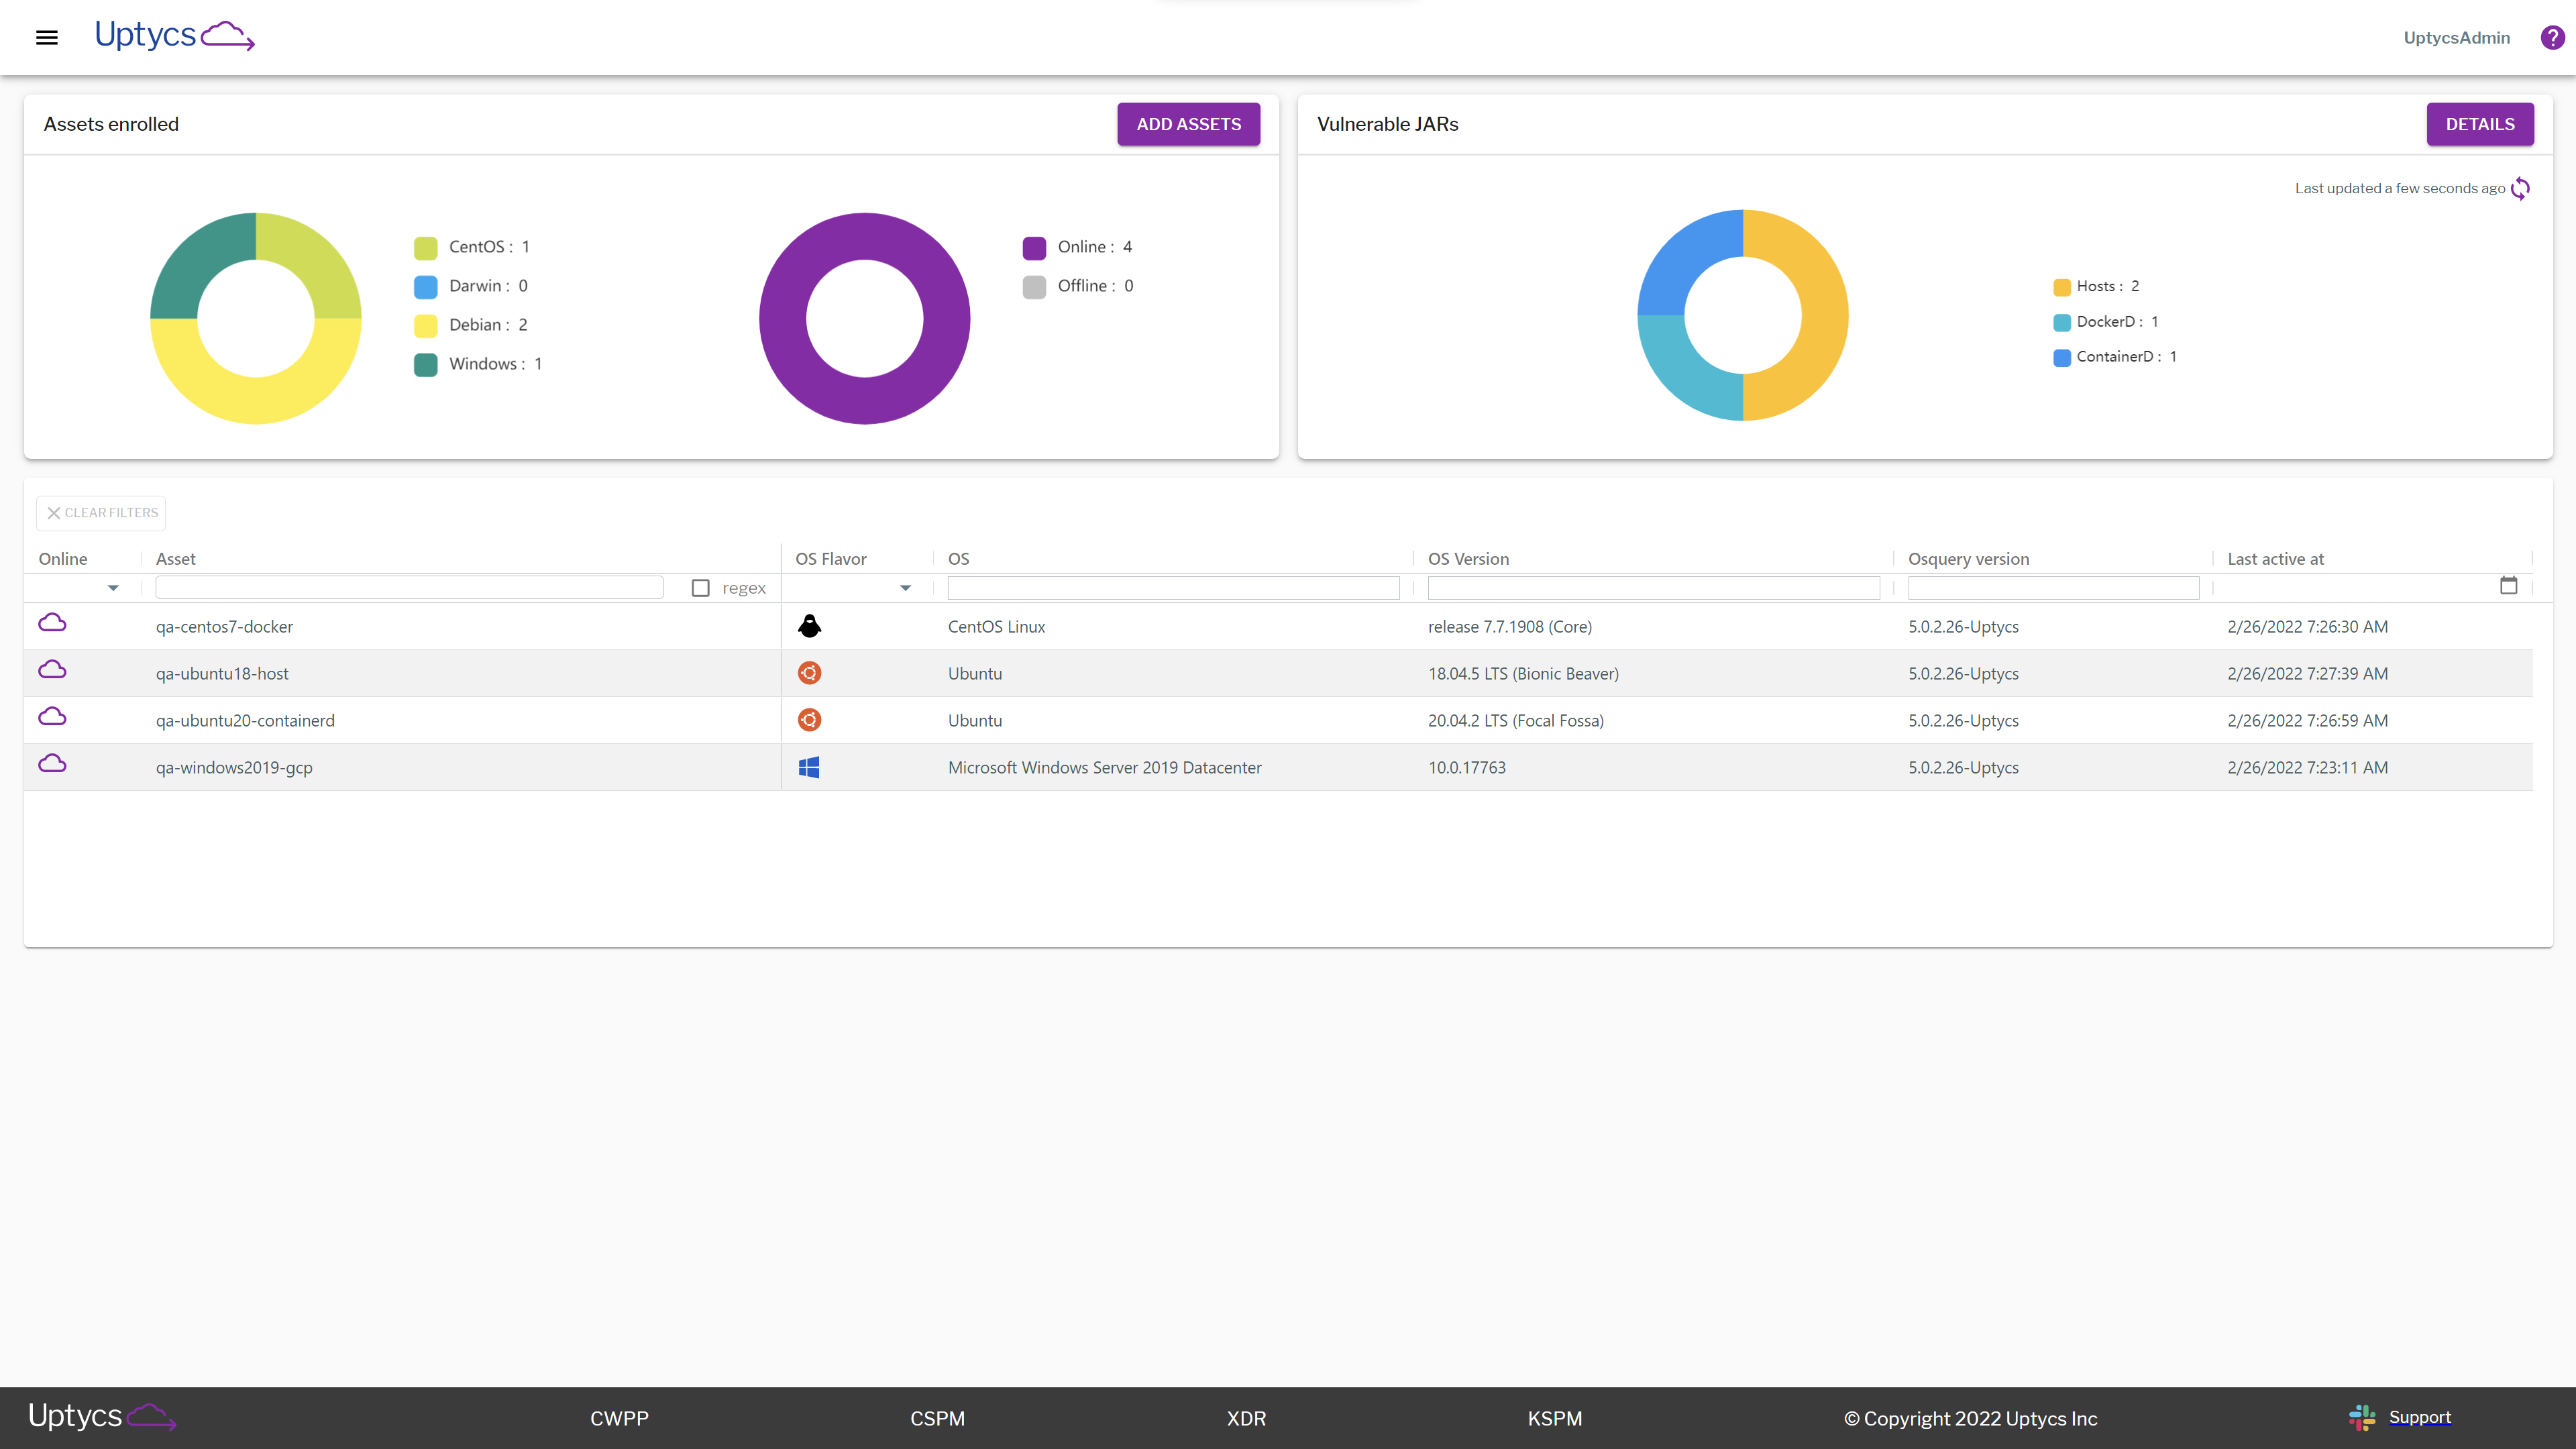
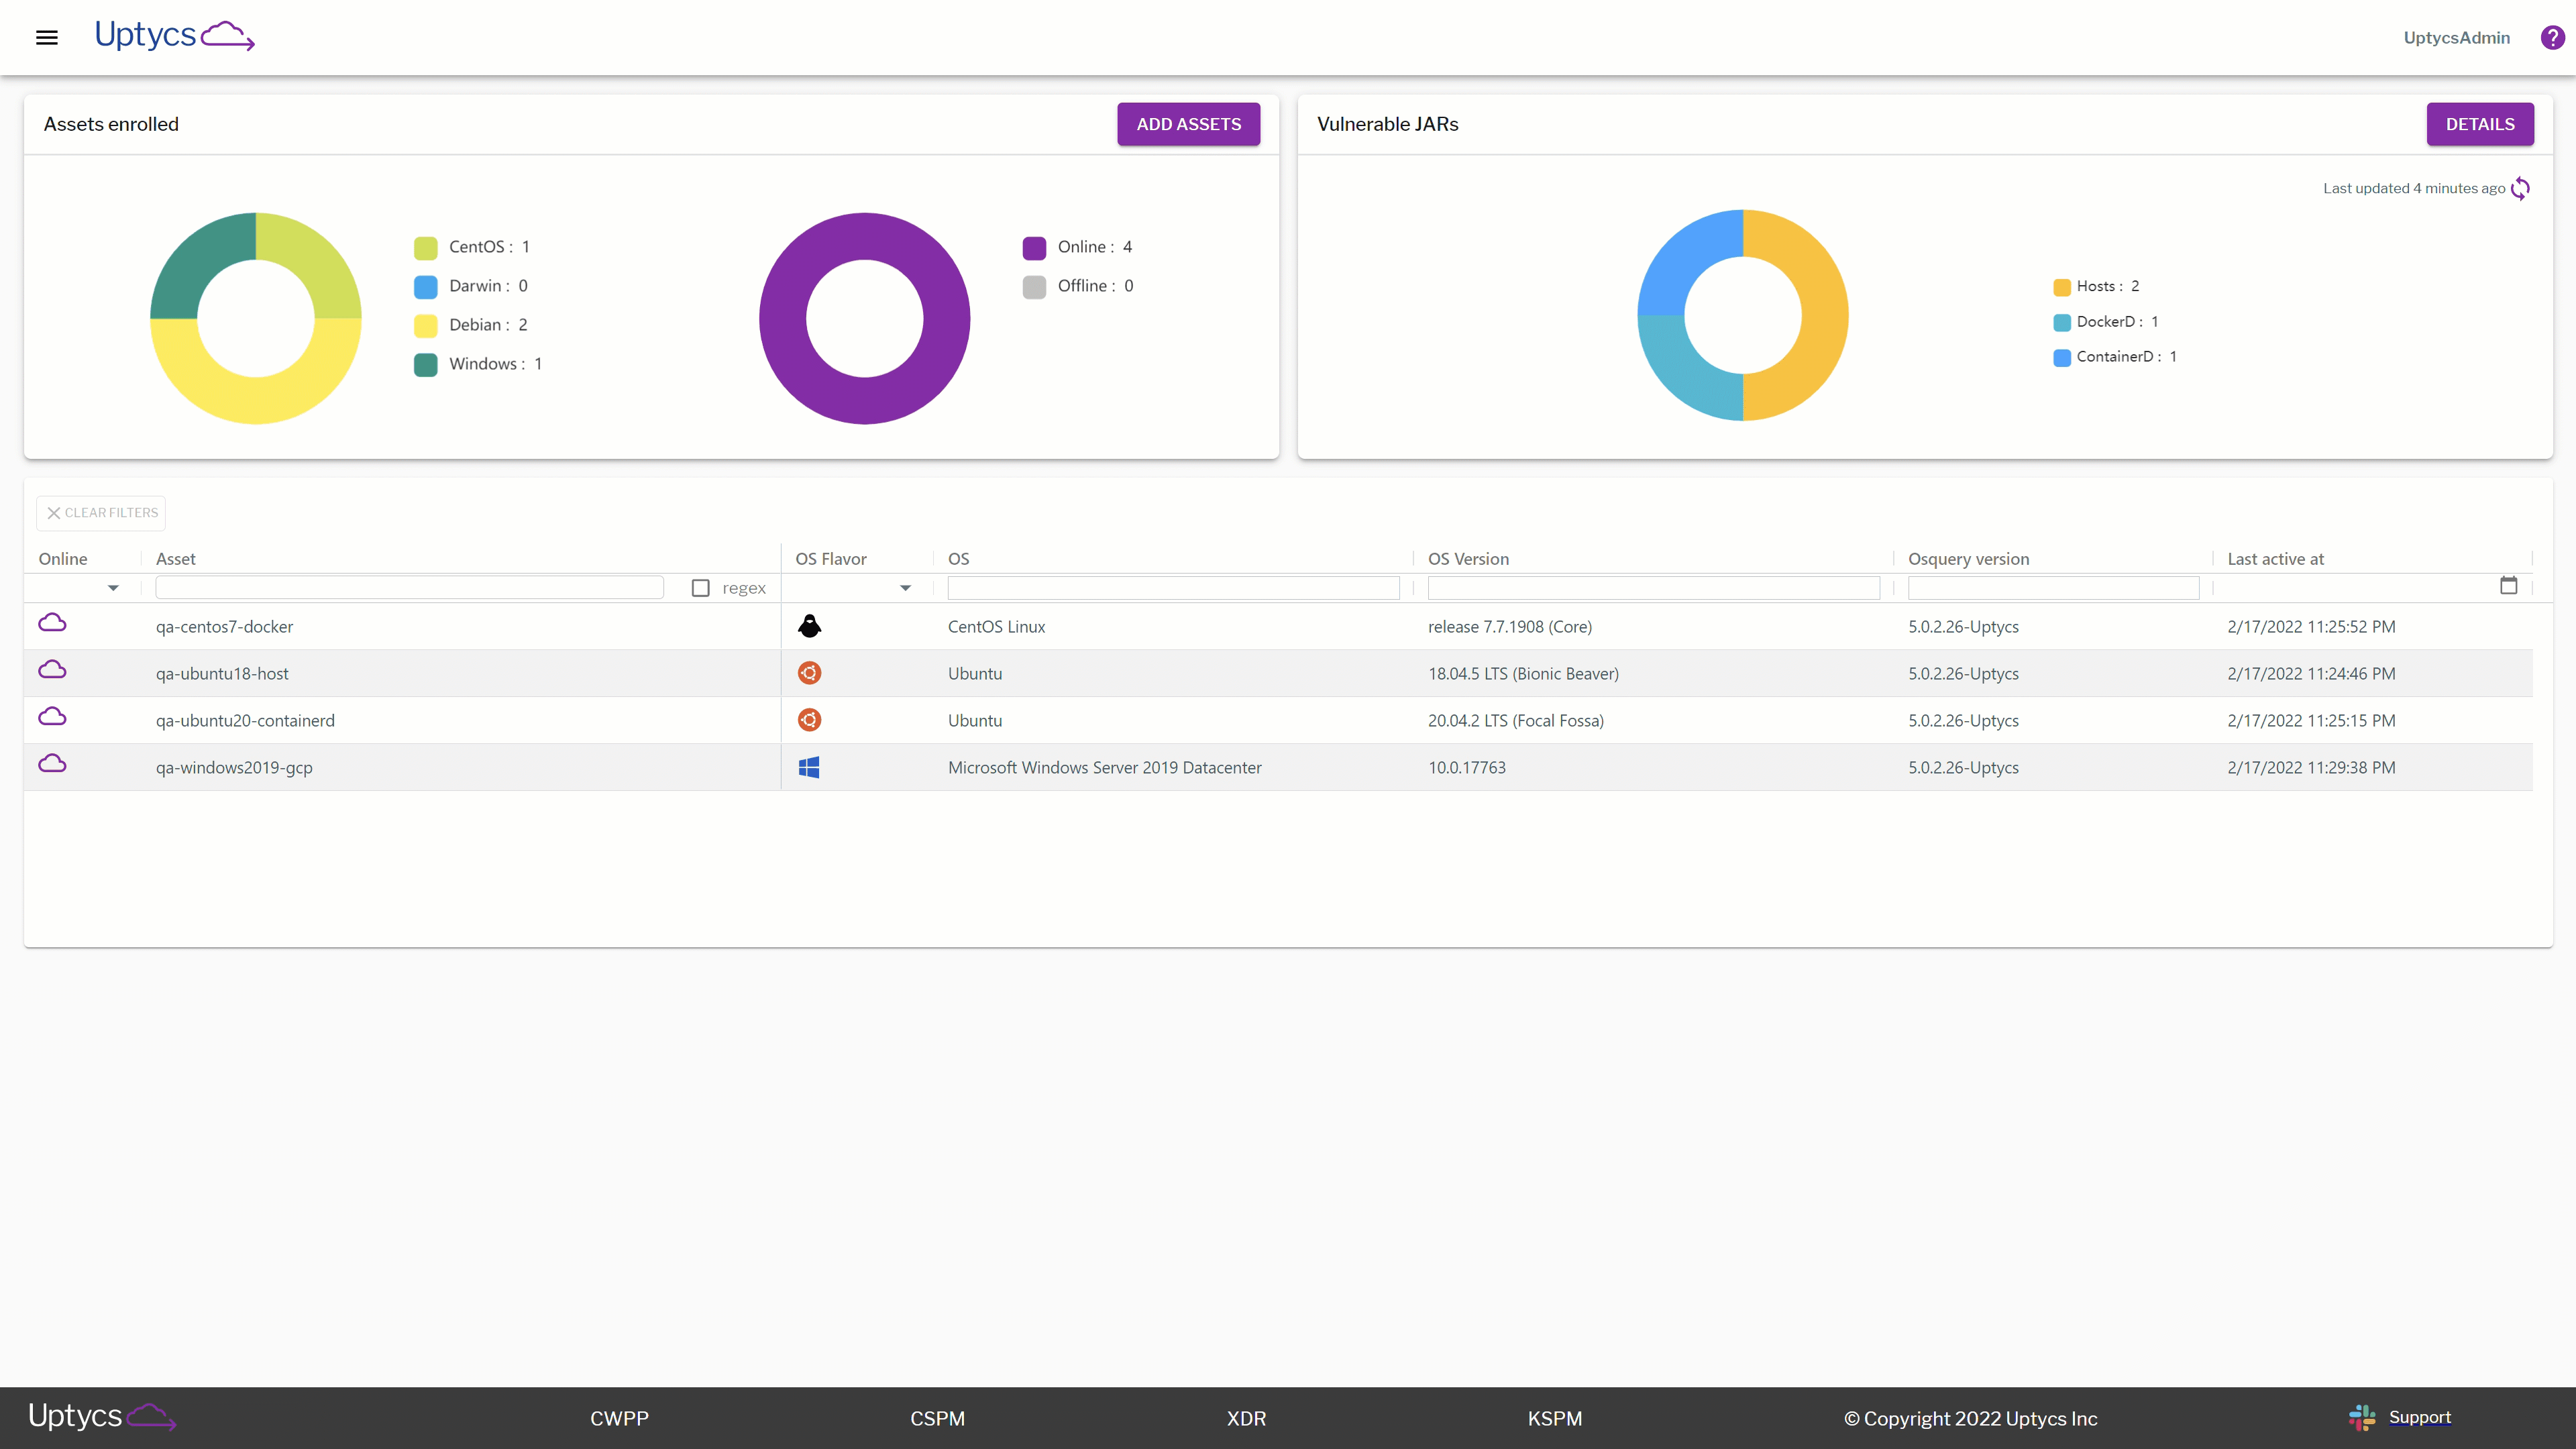
Above, you can see the main dashboard page. After deploying the osquery agent to your assets, it begins querying endpoints and sending telemetry back to the Uptycs data lake. Here you can see a centralized view of your real-time Log4j landscape, partition assets by OS type, version number, vulnerable .jar files, and more.
This dashboard gives you layers of insight and visibility, giving you the answers you need no matter the question. Let’s break this down even further depending on what actions you may want to take.
- Curious about your overall security posture after taking remediation steps?
- Interested in container images that may have vulnerable configurations?
- Is there a specific group of endpoints that you want to validate?
As you update your executive team on the state of your IT ecosystem as it relates to Log4j, use the higher-level view of your current Log4j exposure. Reference the highlighted image below to give a clear and succinct understanding of how many Dockerd instances you have, or break them down further by version numbers, which images are vulnerable, and even further see what exact container IDs and paths are vulnerable for each image.
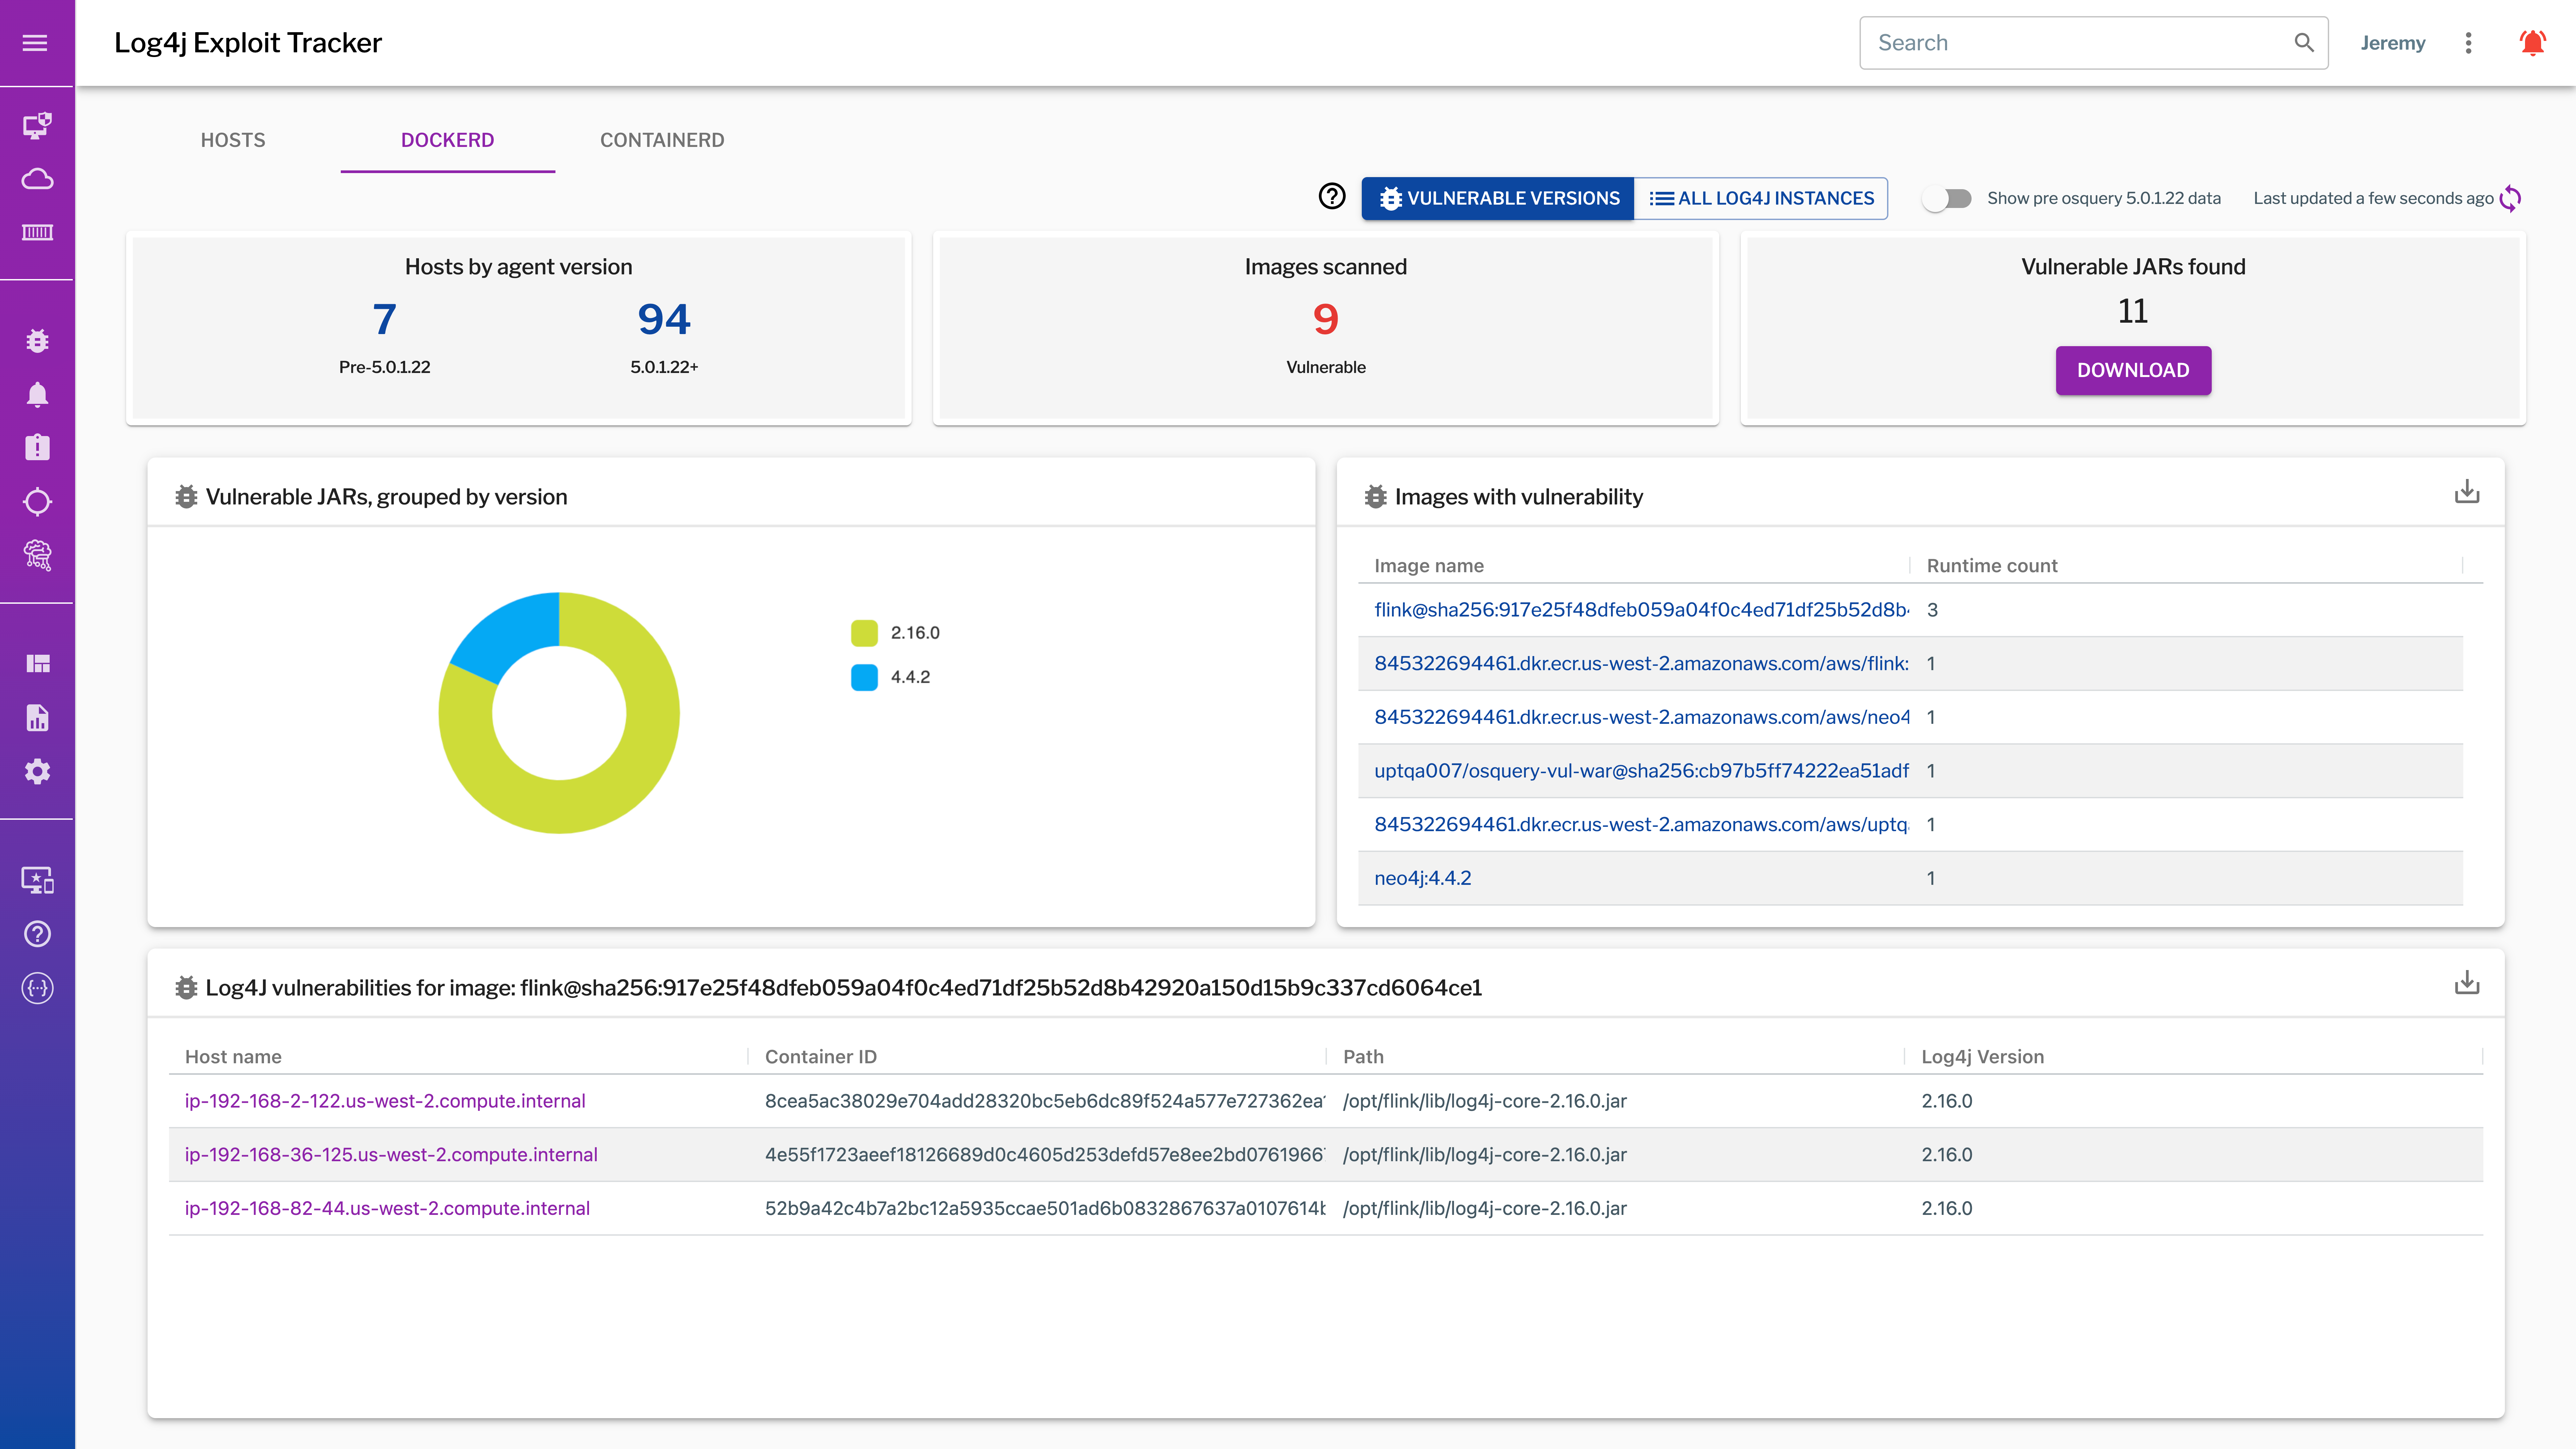
As we dig deeper into our dashboard, we also want to go a layer down technically. If you’re a security engineer trying to investigate specific configurations, look no further! In this section we don’t just tell you that there is an asset or container image you may want to look at, we take that one step further and show you exactly what insights you should be catching.
For example, you may be interested in which specific assets are running vulnerable versions of Log4j. In the gif below, see how quickly we go from a macro view of which assets are vulnerable to drilling down into specific container images and which assets are configured with vulnerable Log4j configs.